
Research article/ Open Access
DOI:10.31488/EJRM.153
Building Resilience and Vital Equity (BRAVE): Did A COVID-19 Health Education Program Influence Vaccine Decision-Making by American Indians in North Carolina?
Tracie Locklear*1, Mary Ann Jacobs2 , Kristen Rimberg3 , Laurin Brown4 , Irene Doherty5 , Celeste Hunt6 , Jennifer Locklear7 , Chunming Jin1, Leslie Yanick7, Cherry Beasley6, Deepak Kumar5
1. Department of Pharmaceutical Sciences, North Carolina Central University, Durham, NC 27707
2. Department of American Indian Studies, University of North Carolina at Pembroke, Pembroke NC 28372
3. Department of Health and Human Services, Austin, TX 78711
4. Westat, Rockville, MD 20850
5. Julius L. Chambers Biomedical/Biotechnology Research Institute (BBRI), North Carolina Central University, Durham, NC 27707
6. Lumbee Tribe of North Carolina, Pembroke, NC 28372
7. The McKenzie-Elliott School of Nursing, University of North Carolina at Pembroke, Pembroke NC 28372
*Corresponding author: : Tracie Locklear, Department of Pharmaceutical Sciences, North Carolina Central University, Durham, NC 27707, Tel: (919)-530-6251.
Abstract
Purpose: We evaluated the impact of a COVID-19 education by culturally concordant nurses to reduce vaccine hesitancy among American Indians. The primary outcome was change in vaccine hesitancy after an in-person health education delivered by nurses from the same ethnic background and local tribal community. Methods: Pre-surveys were given to participants assessing vaccination status and hesitancy, followed by delivery of COVID-19 health education by American Indian nurses from the community. Education included in-person delivery of current COVID-19 information released by the Centers for Disease Control and Prevention and local health department covering the following information: COVID-19 vaccination eligibility and high-risk populations; virus transmission; safety measures; how vaccinations lower the risk of COVID-19 infection; and health risks of un-vaccination. Education was accompanied by pamphlets from the CDC. Post-surveys assessed COVID-19 knowledge, vaccination interest, impact of education on decision-making, and vaccination hesitancy. McNemar’s test was used to measure change in hesitancy. Results: Our study population had a high vaccination rate (76.4%) prior to education. After the health education, 20% of unvaccinated respondents expressed interest in receiving a vaccination (p-value= 0.0004). Reasons for continued hesitancy included side effects (30.5%), unsure of vaccine effectiveness (6.8%) and distrust in the vaccine and government (21.2% and 9.3% respectively), and don’t know enough about the vaccine (8.5%). Unvaccinated participants were more likely to respond “No”, the education did not help them make a decision about getting the COVID-19 vaccine (61.1% vs 9.7% vaccinated). This trend held for decisions regarding children (70.6% unvaccinated vs. 17.6% vaccinated).conclusion: Our study demonstrated a significant influence of culturally concordant health care professionals on vaccine hesitancy. We found no significant difference in demographics between vaccinated and unvaccinated participants no correlation between education or income and vaccination status, due to our small sample size. Findings suggest that cultural influence on vaccine education is finite. Additional research is needed to address remaining barriers to vaccination that exist.
Keywords: Vaccine hesitancy, COVID-19, health disparities, American Indian/Native American
Introduction
The COVID-19 pandemic in the United States worsened already ingrained health disparities among racial/ethnic minoritized populations. Historically, American Indians have disproportionately suffered from infectious and chronic diseases, which extended to COVID-19 [1]. American Indians and Alaska Natives were 3.5 times as likely to contract COVID-19 than their non-Hispanic White peers [2]. Analyses of the COVID-19 mortality using National Center for Health Statistics from February 2020 to September 2023 showed that American Indians and Alaska Natives sustained elevated mortality over the course of the pandemic. During four surges of mortality, the age-adjusted rates were approximately twice as high as non-Hispanic Whites [3].
The largest American Indian population east of the Mississippi River, lives in North Carolina (NC) with 8 state-recognized Tribal Nations (the Eastern Band of Cherokee Indians is also federally recognized). According to the 2020 US Census NC has over 167,000 individuals solely identifying as American Indian (1.2% of the total state population). However, there is a paucity of data in the literature on COVID-19 testing, vaccination rates and vaccine hesitancy rates among American Indians, especially those living in NC and the American Southeast in general. More than half of NC’s Tribal members live in rural Tier 1 counties. Tier 1 counties are those defined as one of the 40 most distressed counties on the basis of: 1) unemployment, 2) median household income, 3) population growth, and 4) assessed property value per capita [4].While the Eastern Band of Cherokee is the only fully federally recognized Tribe in NC, the Lumbee Tribe is the largest with a Tribal territory encompassing Cumberland, Scotland, Hoke, and Robeson Counties, all of which are classified as Tier 1 counties [5]. State-recognized tribal citizens in North Carolina do not have access to healthcare through the Indian Health Service IHS clinics; IHS is only available to federally recognized Tribes.
Elevated COVID-19 vaccine hesitancy stemming from ingrained distrust, incidence disparities, and excess mortality, coupled with less access to health care left American Indian communities especially vulnerable to adverse impacts of COVID-19 at multiple levels. To combat this reality, the evaluation objectives of the Building Resiliency and Vital Equity Project (BRAVE) was to document the perceptions of COVID-19 risk within the American Indian communities located in the Lumbee Tribal territory and to collect data and evaluate educational strategies tailored to addressing barriers surrounding testing and vaccination. Our earlier research from qualitative virtual interviews of 26 respondents revealed that American Indian community members in NC relied heavily on social media (31%) and television news (81%) for information about COVID-19 at the beginning of the pandemic [6]. Nationally vaccine hesitancy has varied by race and ethnicity and diminished over time. A national study of over 5 million Facebook users conducted in Jan 2021-May 2021, estimated that by May 2021(five months after the FDA approved vaccines), 16.6% (95% CI, 16.4, 16.7) of respondents remained hesitant. The prevalence of hesitancy, however, was highest among American Indians [24.9% (23.0, 26.8) and they were 1.60 (95%CI(1.48, 1.73)) times as likely to report it than White respondents [7].
On the basis of findings from our virtual interviews, we surmised that tribal members preferred information about COVID-19 be communicated through local health department outreach (35%), the tribal office or community church (31%), as well as through trusted Indigenous community members (15%) [6-8]. We hypothesized that information communicated in partnership with the Lumbee Tribe, church, and trusted American Indian community members referred throughout this article as “trusted partners” could positively impact uptake of COVID-19 information as well as increase vaccination rates. Nationally, health provider recommendations continued to be considered the best intervention for increasing vaccination uptake [9]. Additionally, delivering effective vaccine messaging via trusted messengers has been cited as an effective strategy for improving vaccination hesitancy in communities with high mistrust, low health literacy, social media misinformation, and lack of adequate health information [9].
This BRAVE Project evaluation study, called the Protect Your Elders (PYE) aimed to investigate whether the delivery of a culturally relevant COVID-19 education intervention for American Indians, by culturally concordant health care professionals (“trusted partners”), could reduce vaccine hesitancy. The secondary outcome was to determine if participants learned new information that influenced their healthcare decision-making.
Methods
Participants were recruited from 13 community events between February 2022 to August 2022 hosted by our local partners, the Lumbee Tribe of North Carolina, McKenzie-Elliott School of Nursing at the University of North Carolina at Pembroke, the Burnt Swamp Baptist Association and the Community Organized Relief Effort (CORE). Events were held in Cumberland, Robeson, and Scotland Counties where most American Indian tribal members live. These events included community-sponsored powwows, church gatherings, and COVID-19 testing and vaccination events at apartment complexes, local hospitals, the University of North Carolina at Pembroke campus, local malls, and the Lumbee Tribe of North Carolina tribal grounds. Eligibility criteria included adults at least 18 years of age, self-identified as American Indian, and residing in Robeson, Hoke, Cumberland, or Scotland Counties. The study components included the following activities in the order listed: 1) complete consent form; 2) complete a paper-based pre-education short survey; 3) participate in an in-person educational session about COVID-19 and the vaccine with a culturally concordant healthcare professional (“trusted partner”); and 4) complete a paper-based post-education survey. The entire process took about 20 minutes. Surveys were self-administered, though some participants asked for assistance reading the documents. Participants received a $25 gift card (later increased to $40) incentive. Identifying information, except zip code, were removed from the data before conducting data analysis. Data from paper forms were entered into a Qualtrics database and coded by study key personnel. The Lumbee Tribe of North Carolina participated in and approved this study as well as the IRB at the North Carolina Central University (IRB# 1201571).
The brave “protect your elders” (pye) educational intervention
The objective of the PYE study was to determine the level of hesitancy for COVID-19 vaccination following the educational event. The primary outcome was a change in vaccination hesitancy. The secondary outcome assessed a change in healthcare decision-making. The PYE educational intervention was delivered by culturally concordant members of the American Indian community affiliated with the McKenzie-Elliott School of Nursing at the University of North Carolina at Pembroke (UNCP), assisted by nursing students, and considered to be “trusted partners” based on findings from our previous study [8]. The education composed a verbal delivery of current COVID-19 information released by the Centers for Disease Control and Prevention as well as the Robeson County Health Department. The verbal education was accompanied pamphlets taken directly from the CDC website covering the following information: the demographics of the COVID-19 vaccination’s target population; virus transmission and methods of protecting one’s own safety and the health of others; the vaccine’s method of action in lowering the risk of COVID-19 infection; and risks to one’s health from choosing not to receive the vaccination. Additionally, the nursing staff spoke to concerns raised that were specific to the American Indian community (e.g., high morbidity and mortality of AI people nationally, questions about high COVID-19 positive rates locally, diabetes and COVID-19, church attendance, masking children, mis and disinformation, in addition to distributing food, stress balls, masks and hand sanitizers, and a list of places in the neighborhoods where vaccinations could be received if not available onsite at the time of the information session or in the event the individual wanted additional time to make an informed decision.
Measures
The pre-educational survey assessed socioeconomic status, history of COVID-19 testing and COVID-19 vaccination, and vaccine hesitancy. The post-education survey assessed the level of hesitancy for COVID-19 testing and vaccination.
The initial vaccination hesitancy outcome variable was assessed prior to the PYE education intervention using RADxUP CDE version 1.1 vaccine hesitancy questions: “Have you received a COVID-19 vaccine”? Possible responses included, “yes” and “no”, “Do you want to get a COVID-19 vaccine?” Possible responses included, “yes”, “no”, and “Don’t know/not sure”, and “If you do not plan to get vaccinated, please tell us why (Select all that apply)”? Possible responses included, “Allergic to vaccines”, “Don’t like needles”, “Concerned about getting COVID-19”, “Concerned about side effects from the vaccine”, “Don’t think vaccines work very well”, “Don’t trust the vaccine”, “Don’t trust the government”, “Don’t believe the COVID-19 pandemic is as bad as some say it is”, “Don’t want to pay for it”, “Don’t know enough about how COVID-19 vaccine works”, and “My health condition (other than allergies) does not allow me to get vaccinated”.
Following the PYE education, changes in vaccine hesitancy were assessed by the following questions: “Please tell us about your vaccination plans, after listening to the presentation”. Possible responses included, “If available, you will get vaccinated today”, “You are planning to make an appointment to be vaccinated”, “You have no plans to get vaccinated”, “Not applicable- You are already vaccinated”; and “If you do not plan to get vaccinated please tell us why you do not plan to get vaccinated (Select all that apply)”. Possible responses included, “Allergic to vaccines”, “Don’t like needles”, “Concerned about getting COVID-19”, “Concerned about side effects from the vaccine”, “Don’t think vaccines work very well”, “Don’t trust the vaccine”, “Don’t trust the government”, “Don’t believe the COVID-19 pandemic is as bad as some say it is”, “Don’t want to pay for it”, “Don’t know enough about how COVID-19 vaccine works”, and “My health condition (other than allergies) does not allow me to get vaccinated”.
The secondary outcome was to determine if participants learned new information that influenced their healthcare decision-making. The influence of the PYE education on decision-making was assessed by the following questions: “Did you learn something new about COVID-19 after listening to the presentation”? Possible responses included, “yes” and “no”, “Do you think you will share or tell people what you learned at this presentation”? Possible responses included, “yes” and “no”, “Has this presentation helped you make a decision about receiving a COVID vaccine for yourself”? Possible responses included, “yes”, “no”, and “not applicable”, “Has this presentation helped you make a decision about receiving a COVID vaccine for your children”? Possible responses included, “yes”, “no”, and “not applicable”, “Please tell us about your vaccination plans, after listening to the presentation”. Possible responses included, “If available, you will get vaccinated today”, “You are planning to make an appointment to be vaccinated”, “You have no plans to get vaccinated”, “Not applicable- You are already vaccinated”.
Analysis
All analyses were conducted using Microsoft Excel 2016. The analysis generated descriptive statistics and tabular analysis with Chi Square or Fisher’s exact tests. McNemar’s test was used to estimate the change in hesitancy among unvaccinated participants. We grouped respondents from “Have you received a COVID-19 vaccine”=“yes” and “Do you want to get a COVID-19 vaccine?” =“yes” into one category as “Vaccinated or plan to”. Likewise, we grouped respondents from “Have you received a COVID-19 vaccine”=“no”, and “Do you want to get a COVID-19 vaccine?” = “no” and “not sure”, into the category “Unvaccinated”. Finally, we grouped respondents based on responses from “Have you received a COVID-19 vaccine”= “no”, “Do you want to get a COVID-19 vaccine?” = “no” and “not sure”, and the post education variable “If available, you will get vaccinated today”? = “You have no plans to get vaccinated” into one category as “Refusers”.
Results
A total of 406 people participated in the educational program at one of the 13 community events between February to August 2022. Responses from people who did not identify as American Indian (n=17) or did not report a zip code or reported a zip code outside of Robeson, Scotland, Hoke or Cumberland Counties (n=51) were ineligible and eliminated from the dataset, leaving 338 eligible responses. A majority of the respondents were women (71.9%) with a mean age of 49.8 (SD 16.8) (Table 1). Thirty percent completed some college or trade school whereas 24% and 20.1% completed a bachelor’s or graduate degree respectively. A small proportion reported an annual income of below $20,000 (17.2%) whereas 22.5% reported an annual income of at least $80,000. Most participants worked (61.2%), 19.8% retired and few were unemployed and seeking work (4.4%). Only 6.8% of respondents were uninsured while the majority had either private (57.1%) or public insurance (32.5%).
Table 1. Participant Demographics
| Frequency | (%) | |
|---|---|---|
| Total Participants | 338 | 100 |
| Gender | ||
| Male | 89 | (26.3) |
| Female | 243 | (71.9) |
| None of these describe me | 1 | (0.3) |
| Prefer not to answer | 5 | (1.5) |
| Age | ||
| 18-39 | 90 | (27.5) |
| 40-59 | 137 | (41.9) |
| ≥60 | 100 | (30.6) |
| mean age/std dev | 49.8 | (16.8) |
| median age/ (inter-quartile range) | 51 | 38.0- 62.5 |
| Highest level of education | ||
| Less than high school | 30 | (8.9) |
| High school diploma/GED | 57 | (16.9) |
| Some college or trade school | 102 | (30.1) |
| Bachelor degree | 81 | (24.0) |
| Graduate school | 68 | (20.1) |
| Annual income | ||
| <$20,000 | 58 | (17.2) |
| $20,000 to $39,999 | 74 | (21.9) |
| $40,000 to $59,999 | 49 | (14.5) |
| $60,000 to $79,999 | 46 | (13.6) |
| $80,000 or more | 76 | (22.5) |
| Prefer not to answer | 35 | (10.3) |
| Household composition | ||
| Live alone | 75 | (22.2) |
| Live with spouse only | 71 | (21.0) |
| Family including children | 146 | (43.2) |
| Family 3 generations | 28 | (8.3) |
| Family 4 generations | 6 | (1.8) |
| None of these | 12 | (3.5) |
| Employment status | ||
| Working now | 207 | (61.2) |
| Looking for work, unemployed | 15 | (4.4) |
| Unemployed and not looking for work | 10 | (3.0) |
| Retired | 67 | (19.8) |
| Disabled permanently or temporarily | 26 | (7.7) |
| Student | 9 | (2.7) |
| Prefer not to answer | 4 | (1.2) |
| Health insurance | ||
| None | 23 | (6.8) |
| Private | 193 | (57.1) |
| Public | 110 | (32.5) |
| Don’t know | 3 | (0.9) |
| Prefer not to answer | 9 | (2.7) |
COVID-19 Testing and Vaccine Hesitancy Pre-Education
Nearly half of respondents (n=158, 47.3%) reported having tested positive for COVID-19 or being told by a health care provider that they had it (Table 2). Of the 337 respondents who responded, only 36 (10.6%) had never been tested. The most frequent response for testing was 1-2 times (35.0%) and 3-5 times (31.5%). Thirty-five people (10.4%) responded that they had been tested more than 10 times. The majority of respondents, 76.4%, reported that they had received a COVID-19 vaccine, before the educational session was presented.
Table 2. Prevalence of COVID-19 in population and vaccine hesitancy
| Frequency | Percent (%) | |
|---|---|---|
| Have you had COVID-19? (Have you tested positive for COVID-19 or told been by a health care provider that you had it)? | ||
| Yes | 158 | 47.3 |
| No | 176 | 52.7 |
| Total | 334 | 100.0 |
| Since the pandemic began, how many times (if any) did you get tested for COVID? | ||
| Zero | 36 | 10.6 |
| 1 or 2 | 118 | 35.0 |
| 3 to 5 | 106 | 31.5 |
| 6 to 10 | 42 | 12.5 |
| More than 10 times | 35 | 10.4 |
| Total | 337 | 100.0 |
| Have you received a COVID-19 vaccine? | ||
| Yes | 252 | 76.4 |
| No | 78 | 23.6 |
| Total | 330 | 100.0 |
| Did you learn something new about COVID-19 after listening to this presentation? | ||
| Yes | 283 | 85.2 |
| No | 49 | 14.8 |
| Total | 332 | 100.0 |
| Would you recommend this presentation to someone else? (friends, family, others) | ||
| Yes | 328 | 98.2 |
| No | 6 | 1.8 |
| Total | 334 | 100.0 |
| Do you think you will share or tell people what you learned at this presentation? | ||
| Yes | 323 | 97.0 |
| No | 10 | 3.0 |
| Total | 333 | 100.0 |
| Has this presentation helped you make a decision about receiving a COVID vaccine for yourself? | ||
| Yes | 154 | 76.6 |
| No | 47 | 23.4 |
| Total | 201 | 100.0 |
| Has this presentation helped you make a decision about receiving a COVID vaccine for your child? | ||
| Yes | 80 | 67.2 |
| No | 39 | 32.8 |
| Total | 119 | 100.0 |
Post Education Decision-making
Most respondents (85.2%) felt that they learned something new about COVID-19 after listening to the presentation and 98.2% responded that they would recommend the presentation to someone else, such as a friend or family member (Table 2). When we asked if the presentation helped respondents make a decision about receiving a COVID-19 vaccine for themselves or for their children, we found that respondents were more likely to use the education to make decisions regarding themselves but not for their children (76.6% versus 67.2%, respectively) (Table 2).
Improvement in Decision-making: Decrease in Vaccine Hesitancy Post-Education
After education, 20% of unvaccinated respondents expressed interest in receiving a vaccination on the post-survey (p-value= 0.0004). There was no significant difference between COVID-19 infections between vaccinated and unvaccinated participants (40.7% and 50.8%, respectively). Unvaccinated participants were more likely to respond “No”, the education did not help them make a decision about getting the COVID-19 vaccine (61% vs 9.7% vaccinated) (Table 3a). This trend held for decisions regarding children as well (70.6% unvaccinated vs. 17.6% vaccinated). Reasons for continued hesitancy included side effects (30.5%), unsure of vaccine effectiveness (6.8%) and distrust in the vaccine and government (21.2% and 9.3% respectively), and don’t know enough about the vaccine (8.5) (Figure 1). This attitude did not change if they responded that they had, “learned something new” (81.4%) or would “tell others” about the program (96.6%) (Table 3a). Our sample size was too small for multivariable analysis correlating any subgroup with vaccine hesitancy, however, Table 3b shows the demographics of our study population by vaccination status.
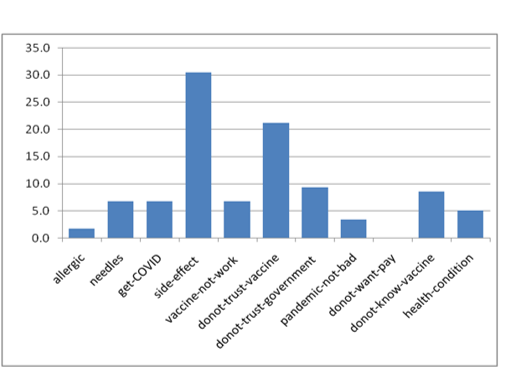
Figure 1:Vaccine Hesitancy among Vaccine Refusers Following PYE Education
Table 3a. Decision-making by Vaccination Status after PYE
| Vaccinated or plan to | Refuse vaccine | |||
|---|---|---|---|---|
| Num | % | Num | % | |
| Since the pandemic began, was there ever a time when you wanted to get a COVID test, but could not? | ||||
| yes | 36 | 14.7 | 5 | 8.3 |
| no | 209 | 85.3 | 57 | 91.7 |
| Total | 245 | 100.0 | 62 | 100.0 |
| Have you had COVID-19? (Have you tested positive for COVID-19 or told been by a health care provider that you had it)? | ||||
| yes | 116 | 47.0 | 30 | 50.8 |
| no | 131 | 53.0 | 29 | 49.2 |
| Total | 247 | 100.0 | 59 | 100.0 |
| Did you learn something new about COVID-19 after listening to this presentation? | ||||
| yes | 212 | 85.5 | 48 | 81.4 |
| no | 36 | 14.5 | 11 | 18.6 |
| Total | 248 | 100.0 | 59 | 100.0 |
| Do you think you will share or tell people what you learned at this presentation? | ||||
| yes | 241 | 96.8 | 56 | 96.6 |
| no | 8 | 3.2 | 2 | 3.4 |
| Total | 249 | 100.0 | 58 | 100.0 |
| Has this presentation helped you make a decision about receiving a COVID vaccine for yourself? | ||||
| yes | 131 | 90.3 | 21 | 38.9 |
| no | 14 | 9.7 | 33 | 61.1 |
| Total | 145 | 100.0 | 54 | 100.0 |
| Has this presentation helped you make a decision about receiving a COVID vaccine for your child? | ||||
| yes | 70 | 82.4 | 10 | 29.4 |
| no | 15 | 17.6 | 24 | 70.6 |
| Total | 85 | 100.0 | 34 | 100.0 |
Table 3b. Demographics by Vaccination Status after PYE
| All responses | Vaccinated or plan to | Refuse vaccine | Total | |||
|---|---|---|---|---|---|---|
| Num | Row % | Num | Row % | Num | % | |
| 250 | 80.6 | 60 | 19.4 | 310 | 100.0 | |
| Gender | ||||||
| Male | 62 | 82.7 | 13 | 17.3 | 75 | 100.0 |
| Female | 185 | 80.4 | 45 | 19.6 | 230 | 100.0 |
| None of these describe me | 3 | 60.0 | 2 | 40.0 | 5 | 100.0 |
| Age groups | ||||||
| 18-39 | 66 | 76.7 | 20 | 23.3 | 86 | 100.0 |
| 40-59 | 105 | 80.8 | 25 | 19.2 | 130 | 100.0 |
| ≥60 | 72 | 85.7 | 12 | 14.3 | 84 | 100.0 |
| Highest level of education | ||||||
| Less than high school | 15 | 65.2 | 8 | 34.8 | 23 | 100.0 |
| High school diploma/GED | 38 | 77.6 | 11 | 22.4 | 49 | 100.0 |
| Some college or trade school | 69 | 79.3 | 18 | 20.7 | 87 | 100.0 |
| Bachelor degree | 62 | 82.7 | 13 | 17.3 | 75 | 100.0 |
| Graduate school | 49 | 83.1 | 10 | 16.9 | 59 | 100.0 |
| Annual Income | ||||||
| <$20,000 | 37 | 72.5 | 14 | 27.5 | 51 | 100.0 |
| $20,000 to $39,999 | 49 | 75.4 | 16 | 24.6 | 65 | 100.0 |
| $40,000 to $59,999 | 35 | 77.8 | 10 | 22.2 | 45 | 100.0 |
| $60,000 to $79,999 | 41 | 93.2 | 3 | 6.8 | 44 | 100.0 |
| $80,000 or more | 59 | 80.8 | 14 | 19.2 | 73 | 100.0 |
| Prefer not to answer | 29 | 90.6 | 3 | 9.4 | 32 | 100.0 |
| Employment status | ||||||
| Working now | 154 | 79.0 | 41 | 21.0 | 195 | 100.0 |
| Looking for work, unemployed | 9 | 60.0 | 6 | 40.0 | 15 | 100.0 |
| Unemployed and not looking for work | 8 | 80.0 | 2 | 20.0 | 10 | 100.0 |
| Retired | 51 | 91.1 | 5 | 8.9 | 56 | 100.0 |
| Disabled permanently or temporarily | 17 | 73.9 | 6 | 26.1 | 23 | 100.0 |
| Student | 9 | 100.0 | 0 | 0.0 | 9 | 100.0 |
| Prefer not to answer | 2 | 100.0 | 0 | 0.0 | 2 | 100.0 |
Conclusion
Most participants in the PYE study lived in Scotland and Robeson counties. Nearly 50% of respondents reported having had a COVID-19 infection. Unexpectedly, our study population had a high vaccination rate (76.4%). Given the high vaccination in the sample and few hesitant, the sample size was too small to further multivariable analysis to yield meaningful findings.
A possible explanation for the high vaccination rate in our population may be due community-embedded COVID-19 education initiatives that began prior to our study. In April 2020, the Lumbee Tribe in collaboration with the (UNCP) McKenzie-Elliott School of Nursing met and began planning drive-in COVID-19 screenings. Free, open to the public, screenings started in May 2020 and were held at the tribal administration building, supported by the UNCP nursing faculty, Tribal staff, and Tribal Council. During this time, nurses also addressed COVID-19 misinformation, and attendees’ specific health concerns. Additional needs such as food, personal protective equipment (PPE), and school supplies were also met. These initiatives helped establish trust, belonging, and community interconnectedness, laying a strong foundation of support for COVID-19 vaccinations.
Between August 2021 and August 2022, the Lumbee Tribe in collaboration with the (UNCP) McKenzie-Elliott School of Nursing were providing COVID-19 education at the community level and addressing misinformation. COVID-19 health education radio call-in question and answer sessions also allowed people to share stories about people they had lost. Meanwhile, in-person presentations were conducted targeting local pastors addressing disease transmission, ways to protect oneself and family, history of vaccines, previous work on mRNA vaccines, as well misinformation about COVID-19. These outreach initiatives ultimately lead to the creation and dissemination of a COVID-19 educational video by the Lumbee Tribe.
The objective of the PYE education was to alleviate fears, dispel myths and directly address misinformation in real-time, through the cultural lens of a trained health care professional from the local tribal community. The Nurses from UNCP’s McKenzie-Elliott School of Nursing answered questions, and engaged in one-on-one discussions to alleviate fears, dispel myths, misinformation in real-time. Participants received community-tailored educational materials from trusted sources (e.g., CDC, and Robeson County Health Department) and were well equipped with accurate information to facilitate informed decision-making. Yet, most unvaccinated respondents did not change their decision regarding vaccination, even when they were provided with education by trusted healthcare professionals that were part of the American Indian community or reported that they learned something new and would share that information with others. The most commons reasons refusers gave for not being vaccinated included side effects (30.5%), unsure of vaccine effectiveness (6.8%) and distrust in the vaccine and government (21.2% and 9.3% respectively), and don’t know enough about the vaccine (8.5) (Figure 1).
Discussion
In general, American Indians have a higher level of distrust in western medicine and research, lower levels of health care satisfaction due to colonization, genocide (including biological warfare), medical experimentation, and ethnocide (e.g., sterilization and boarding schools)[10–14]. In 2021, the Lumbee Tribe had the lowest vaccination rate in Robeson County with only 26% having received at least the first dose of the vaccine [15,16]. Robeson County had the lowest vaccination rate in the state during the same period (27%) [17]. The high vaccination rate within our PYE population was unanticipated, but explicable and supported by similar results observed nationally [18,19]. Our data may provide evidence of the role that tribal governments can play in the public health of their citizens. Now in 2024, American Indians have the lowest vaccination rate by race nationally, 69.5% compared to highest vaccination population being Asians with 94.5%. This new information highlights the continued need for focus on coordinated efforts by academic organizations and tribal governments to develop and sustain culturally appropriate targeted health interventions in American Indian communities [20,21].
The PYE results show a considerably positive shift in perception regarding COVID-19 vaccination from the survey we conducted over a month from December 2020 to January 2021 [8]. Those data from 2020 showed that only 28% of American Indian participants reported that they would “definitely get” the vaccine, compared to White, Black, and Latino participants (63%, 42%, and 26%, respectively). This study showed that vaccine hesitancy still exists and was not improved by in-person education by “trusted partners” in the community. While the urgency of the COVID-19 pandemic may have yielded to endemic complacency, there are lessons to be learned from the vaccine rollout and public health response at all levels of civic life, especially from our most vulnerable communities [22–24]. A model for successful health communication between health educators and tribal members already exists with the Messengers for Health (MFH) a community-based participatory research project, turned 501c3 nonprofit organization that focuses on the breast and cervical cancer prevention for Crow Indian Women [25]. This project began as a trusted and respected Crow women “Messengers” who understood the psychosocial and psycho cultural factors impacting the community, providing outreach and health information in a convenient and culturally relevant context. MFH has since been heralded nationally as a role model for evidenced-based practices in cancer research and prevention. However, COVID-19 was a new disease, whereas breast and cervical cancers do not have social media mis and disinformation competing with health provider information about those diseases.
This study has some limitations. These data are cross-sectional and therefore, we are unable to assess trends in COVID-19 vaccination hesitation over time, especially considering the rapid changes in COVID-19 pandemic health information during the time period of this study. Additionally, simultaneous communication efforts coming from churches, tribes, social media, TV news, etc. could have biased these results. The PYE study used convenience sampling at community events which may have biased results as well. Another limitation was that most of the events were held in Robeson County and attended by American Indian community members from surrounding counties. Representation across Robeson, Cumberland, Hoke and Scotland Counties was not equal. While data from tribal members residing outside of our counties were not included in this study, this highlights issues with using zip code as exclusion criteria. Nevertheless, we observed roughly equal participation across education and income levels. While we attempted to limit bias of surveying at vaccination events by combining data from those that responded that they wanted to be vaccinated in our pre-survey with those already vaccinated, offering vaccinations at events may have biased these results.
In summary, most individuals who participated in the educational session had already been vaccinated or attended the session at an event where access to vaccines were available. That said, we developed and delivered a culturally competent presentation that resonated with the American Indian community that the majority of participants reported that they learned something new. Furthermore, nearly all participants (over 96%) reported that they would share the information that they learned.
Abbreviations
PYE: Protect Your Elders Campaign; CDE: Common Data Element; RADx-UP: Rapid Acceleration of Diagnostics Underrepresented Populations
Acknowledgements
Grant number: 3R01MD012767-04S1, former 5R01MD012767-04 and RCMI grant U54MD012392
Conceptualization and funding acquisition: Deepak Kumar, Tracie Locklear, Mary Ann Jacobs
Data collection: Kristen Rimberg, Mary Ann Jacobs, Tracie Locklear, Laurin Brown
Formal analysis: Irene Doherty and Chunming Jin
Investigation: Kristen Rimberg, Mary Ann Jacobs, Tracie Locklear
Methodology: Mary Ann Jacobs, Tracie Locklear
Project administration: Kristen Rimberg, Mary Ann Jacobs, Tracie Locklear
Resources: Deepak Kumar, Jennifer Locklear,
Software: Laurin Brown
Supervision: Tracie Locklear
Visualization: Chunming Jin
Writing original draft: Tracie Locklear, Mary Ann Jacobs, Jennifer Jones Locklear
Writing-review & editing: All authors
Thank you to the Lumbee Tribe of North Carolina, University of North Carolina at Pembroke, the Burnt Swamp Baptist Association, our Community Advisory Board, and Ms. Linda Oxendine at the Community Organized Relief Effort (CORE). A special thanks to Dr. Ronny A. Bell and Steven Grambow for their review of this manuscript. Disclosure of interests. No interests were disclosed.
References
1. Ehrenpreis JE, Ehrenpreis ED. A Historical Perspective of Healthcare Disparity and Infectious Disease in the Native American Population. Am J Med Sci. 2022 Jan 24;363(4):288.
2. Brookings Institute . American Indians and Alaska Natives are dying of COVID-19 at shocking rates.
3. Sumibcay JRC, Kunichoff D, Bassett MT. Racial and Ethnic Disparities in COVID-19 Mortality. JAMA Netw Open. 2024 May 21;7(5): e2411656.
4. North Carolina Department of Commerce. Labor & Economic Analysis Division. Changes to County Development Tiers in 2019 . North Carolina Department of Commerce. Labor & Economic Analysis Division; 2024 Mar 20.
5. North Carolina Department of Commerce. Labor & Economic Analysis Division. County Distress Rankings (Tiers). North Carolina Department of Commerce. Labor & Economic Analysis Division; 2024 Mar 20.
6. Shi X, Mehng S, Locklear AK, Kang Z, Locklear T, Locklear MB, et al. COVID-19 Perceptions Among North Carolina Native Americans: Using a Qualitative Approach. N C Med J .2023 Sep 21 ;85(1).
7. King WC, Rubinstein M, Reinhart A, Mejia R. Time trends, factors associated with, and reasons for COVID-19 vaccine hesitancy: A massive online survey of US adults from January-May 2021. PLOS ONE. 2021 Dec 21;16(12):e0260731.
8. Locklear T, Strickland P, Pilkington WF, Hoffler U, Billings V, Zhang T, et al. COVID-19 Testing and Barriers to Vaccine Hesitancy in the Lumbee Tribe of North Carolina. N C Med J. 2021 Nov 1;82(6):406–7.
9. Brewer N. What Works to Increase Vaccination Uptake. Acad Pediatr. 2021;21(4): S9–16.
10. Guadagnolo BA, Cina K, Helbig P, Molloy K, Reiner M, Cook EF, et al. Medical Mistrust and Less Satisfaction With Health Care Among Native Americans Presenting for Cancer Treatment. J Health Care Poor Underserved. 2009;20(1):210–26.
11. Boyd AD, Buchwald D. Factors That Influence Risk Perceptions and Successful COVID-19 Vaccination Communication Campaigns With American Indians. Sci Commun. 2022 Feb;44(1):130–9.
12. Patterson KB, Runge T. Smallpox and the Native American. Am J Med Sci. 2002 Apr 1;323(4):216–22.
13. Carpio MV. The Lost Generation: American Indian Women and Sterilization Abuse. Soc Justice. 2004;31(4 (98)):40–53.
14. Pacheco CM, Daley SM, Brown T, Filippi M, Greiner KA, Daley CM, et al. Moving Forward: Breaking the Cycle of Mistrust Between American Indians and Researchers. Am J Public Health. 2013 Dec;103(12):2152–9.
15. Native Americans have the lowest COVID vaccination rate in Robeson County, despite efforts. Border Belt Independent .2024 Nov 20.
16. Native people have the largest share of COVID cases and deaths in Robeson County. The News&Observer .2024 Nov 20.
17. COVID-19 Integrated County View. COVID Data Tracker [Internet]. Centers for Disease Control and Prevention; 2021 Aug 20.
18. Haroz EE, Kemp CG, O’Keefe VM, Pocock K, Wilson DR, Christensen L, et al. Nurturing Innovation at the Roots: The Success of COVID-19 Vaccination in American Indian and Alaska Native Communities. Am J Public Health. 2022 Mar;112(3):383–7.
19. Hill L, Published SA. COVID-19 Vaccination among American Indian and Alaska Native People . KFF. 2024 Nov 5.
20. COVID data tracker. Demographic Trends [Internet]. Centers for Disease Control and Prevention; 2021 Aug 20.
21. COVID-19 Vaccination Coverage and Vaccine Confidence Among Adults [Internet]. Centers for Disease Control and Prevention; 2021 Aug 20.
22. Bell RA. The Health of American Indians in North Carolina: Honoring the Past, Looking to the Future. N C Med J. 2021 Nov 1;82(6):394–7.
23. Partnering for Vaccine Equity. Partnering for Vaccine Equity. North Carolina Community and Academic Partners Facilitate Talking Circles to Strengthen Vaccine Confidence in Tribal Communities. 2024 Sep 23
24. NCAI POLICY RESEARCH CENTER. COVID-19 Data – Situation Summary [Internet]. NATIONAL CONGRESS OF AMERICAN INDIANS; 2023 May 21.
25. Messengers for Health. HEALTH EDUCATION AND OUTREACH FOR THE CROW PEOPLE.2024 Sep 24.
Received:February 03, 2025;
Accepted: February 27, 2025;
Published: March 04, 2025.
To cite this article : Locklear T, Jacobs MA, Rimberg K, Brown L, Doherty I, Hunt C, et al. Building Resilience and Vital Equity (BRAVE): Did A COVID-19 Health Education Program Influence Vaccine Decision-Making by American Indians in North Carolina? European Journal of Respiratory Medicine. 2025; 7(1): 460- 467. doi: 10.31488/EJRM.153.
© The Author(s) 2025. This is an open access article distributed under the terms of the Creative Commons Attribution License (https://creativecommons.org/licenses/by/4.0/).