Research Article/ Open Access
DOI: 2021; 3(1): 178 – 186 . doi: 10.31488/EJRM.114
Evolution of a Pivotal Clinical Study to Evaluate Extracorporeal Photopheresis for Refractory Bronchiolitis Obliterans
THE EPI STUDY GROUP: Hilary Goldberg MD1, Chadi Hage MD2, Julia Klesney-Tait MD3, Keith Wille MD4, Selim Arcasoy MD5, Gordon Yung MD6, Marshall Hertz MD7, Kevin M. Chan MD8, Matt Morrell MD9, Suresh Vedantham MD10, Mary Clare Derfler MD10, Paul Commean CEE11, Roger Yusen MD12, Michael Wallendorf PhD13, Elizabeth Staley MD14, Alyssa Despotis15, Jacob Linker15, Jeff Atkinson MD16, George Despotis MD17
1. Brigham and Women’s Hospital, Harvard Medical School, Department of Medicine, Division of Pulmonology, USA
2. Indiana University, School of Medicine, Pulmonary Critical Care, Thoracic transplant program, USA
3. University of Iowa Department of Medicine, Division of Pulmonology, USA
4. University of Alabama, Department of Medicine, Division of Pulmonology, USA
5. Columbia University of Alabama, Department of Medicine, Division of Pulmonology, USA
6. University of California San Diego, Department of Medicine, Division of Pulmonology, USA
7. University of Minnesota, Department of Medicine, Division of Pulmonology, USA
8. University of Michigan, Department of Medicine, Division of Pulmonology, USA
9. University of Pittsburgh, Department of Medicine, Division of Pulmonology, USA
10. Clinical Coordinating Center, Washington University School of Medicine, Mallinckrodt Institute of Radiology, USA
11. Data Coordinating Center, Washington University School of Medicine, Mallinckrodt Institute of Radiology, USA
12. Washington University School of Medicine, Department of Internal Medicine, Division of Pulmonary and Critical Care, USA
13. Washington University, Division of Biostatistics
14. University of Washington School of Medicine, Department of Pathology, USA
15. Washington University, USA
16. Washington University School of Medicine, Department of Internal Medicine, Division of Pulmonary Medicine, USA
17. Washington University School of Medicine, Division of Pulmonary and Critical Care Medicine, USA
*Corresponding author: Dr. George Despotis, Department of Pathology & Immunology, Division of Laboratory & Genomic Medicine, Washington University School of Medicine, 425 S. Euclid Avenue, Campus Box 8118, Saint Louis, MO 63110, USA, Tel: 314 362 6586.
Abstract
Background: A preliminary analysis of a Medicare approved Registry study designed to evaluate the efficacy of extracorporeal photopheresis (ECP) to attenuate Bronchiolitis Obliterans (BOS) suggested that earlier detection and treatment of BOS may improve survival, which led to major re-design of the study. Our primary aims for this analysis and mathematical modeling was to quantify the effect of ECP to enhance survival using terminal FEV1 (TFEV1) values. Methods: Multiple databases were used to obtain spirometric data to characterize TFEV1 values (FEV1 before BOS related mortality), create a mathematical model to quantitate the effect of ECP on survival, and estimate requisite enrollment. Results: Spirometry data from 60 patients who met the proposed randomized controlled trial enrollment criteria are summarized (median and IQR): Baseline FEV1 (3105: 2545 to 3705) mL, pre-ECP rate of FEV1 decline (-112: -202 to -77) mL/month, rate of FEV1 six months post-ECP (-18: -48 to 2) mL/month and percent Δ in FEV1 (-86: -102 to -63). A mean TFEV1 of 675 (595 to 855) mL was quantified using data from 60 subjects, with a mean time from the TFEV1 to expiration of 40 days (18 to 70) days. The model projected a 45% increase in survival three years after enrollment in the ECP treatment cohort (58%) when compared to a Standard of Care cohort (40%); enrollment requirements were estimated at 400-450 patients at a 90% power level. Conclusions: Study findings support the feasibility of a randomized trial that is designed to facilitate earlier identification and treatment of obstructive CLAD with ECP that may optimize evaluation of the clinical impact of ECP.
Key Words: Bronchiolitis obliterans syndrome (BOS), extracorporeal photopheresis (ECP), forced expiratory volume in 1 second (FEV1), Lung Transplantation
Introduction
Chronic lung allograft dysfunction (CLAD), predominately related to bronchiolitis obliterans syndrome (BOS), represents the leading cause of morbidity and mortality in recipients of lung allografts beyond the first year [1] which occurs at an annual incidence of 7-8% in the first 10 years after transplant [2]. Extracorporeal photopheresis (ECP), a pheresis-based therapeutic immune-modulatory intervention, has been utilized as an off-label treatment for refractory BOS in lung transplant recipients since the early 1990s [3-9]. Using previous recommendations for assessment of treatment efficacy with spirometry values [10], three of these studies [7-9] demonstrated that ECP reduces the rate of decline of lung function by 80% in lung transplant recipients with BOS. Medicare approved (Medicare Coverage in Evidence Development decision memo), [11] a prospective, multi-center, single-arm registry study in September 2012 designed to evaluate the impact of ECP on the rate of FEV1 decline in patients with treatment-refractory BOS [12]. A recently performed preliminary analysis in 44 patients suggested that ECP may reduce the degree of decline in FEV1; however, 41% of patients had expired with respiratory or graft failure as the predominate primary cause of death in 92%. Moreover, FEV1 values had declined to 62% of baseline values at BOS diagnosis, which likely contributed to the high mortality rates observed in the study [13]. These findings raised the question of (a) whether earlier detection and expedited management of BOS with ECP as first line therapy might arrest disease progression before lung function reaches a critical level; and (b) whether the observed relationship between spirometry values (i.e., rate of decline of FEV1 before and after ECP, as well as terminal FEV1 values) and mortality might be utilized to enhance the feasibility of a modified clinical trial design.
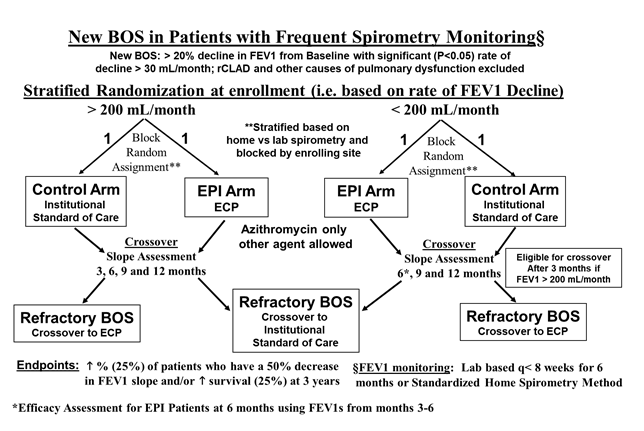
Figure 1:Illustrates the flow diagrams for the Refractory BOS Arm (top diagram) and the Randomized Controlled Trial Arm (bottom diagram).
Accordingly, the specific aims of this study were: to obtain requisite spirometry data, of which some, including terminal FEV1, has not been previously described in the literature, to facilitate essential analyses to enable generation of a model to project cumulative annual mortality and to identify the requisite annual enrollment required to detect a difference in mortality between treatment cohorts. Rates of FEV1 decline and terminal FEV1 values were characterized in the current study. Findings from the current study support the feasibility of a randomized trial that is designed to facilitate earlier identification and treatment of obstructive CLAD with ECP that may optimize evaluation of the clinical impact of ECP using a cumulative annual mortality endpoint.
Materials and Methods
Our original ECP Registry was modified to include a randomized controlled trial (RCT) arm (Figure 1) involving lung transplant recipients with newly diagnosed BOS. The RCT was designed to evaluate the potential effect of ECP on: survival, spirometric response (> 50% decrease in the rate of decline of FEV1 before and 6 months after ECP) and quality of life. The revised protocol can be reviewed within Supplemental Appendix SI (NCT: 02181257).
The RCT within the revised protocol was powered to enroll 739 patients in order to detect a 25% increase in survival at 3 years. To determine if the feasibility of the RCT might be improved, a mathematical model was developed (Supplemental Appendix SII) to enable projections of requisite enrollment for a cumulative annual mortality endpoint. Since the model was predicated on spirometry data along with diagnostic, treatment and study design related factors within the RCT, this necessitated further data acquisition and analyses as described below.
Analytic requirements and data sources for Mathematical Modeling of Cumulative Annual Survival
Characterization of Terminal FEV1
The following two data sources were used to characterize terminal FEV1 (TFEV1: defined as the last FEV1 obtained prior to expiration due to end stage CLAD) and adjusted TFEV1 (TFEV1 modified or reduced based on the product of the time point from measurement of Terminal FEV1 to expiration and rate of TFEV1 decline during the six-month period):
1. Data from a subset (n=18) of 44 subjects enrolled in our original, multicenter, CMS and Therakos® supported registry study (CMS Registry Series) [12] involving lung allograft recipients with refractory BOS who were eligible to be treated with ECP at any of the nine enrolling centers from April 2015 to June 2016 (NCT 02181257).
2. To validate the aforementioned estimate of TFEV1, the electronic medical records from Barnes Jewish Hospital (BJH) were reviewed from a series of 107 lung allograft recipients (BJH Series) who developed BOS via an IRB approved protocol using the following two criteria: the presence of at least six months of spirometry data obtained prior to expiration at a frequency that did not exceed every two months, and documented date of expiration related to end stage pulmonary failure resulting from CLAD. To evaluate the accuracy of our approach to identify the TFEV1, we sought to determine whether or not the TFEV1 was the lowest value observed in the six months prior to expiration. The lowest FEV1 (LFEV1), defined as the lowest value obtained during the six months prior to expiration.
Expected FEV1 values during BOS Surveillance
Data from the aforementioned BJH Series (n=107) was also used to derive an estimate of expected FEV1 values during BOS surveillance, quantified as % of maximum during the monitoring period. Criterion for inclusion of cases for this analysis involved the presence of at least 5 consecutive FEV1 values obtained during the surveillance monitoring period (i.e., defined as the period that included values at least one year after transplant and at least six months before the diagnosis of BOS) in a stable pattern (i.e., no change in FEV1 over time confirmed by statistically insignificant p<0.05 slope values derived using FEV1 vs time during the monitoring period). FEV1 values that occurred within 2 months of a recent infection (i.e., infection was identified using any clinical entry denoting an infection within the electronic medical record) in any subject were excluded from the analysis.
Adjustment of FEV1 values based on the requisite time required for BOS diagnosis
Baseline FEV1 values were reduced by a derived FEV1 volume (i.e., multiplying the rate of initial FEV1 decline by the time required for BOS diagnosis based on data from our preliminary analysis of data from the CMS Registry) in order to reflect expected FEV1 at BOS diagnosis.
Estimation of ECP treatment effect using spirometry
To characterize the case specific effectiveness of ECP in patients who received this treatment, baseline FEV1 as defined by ISHLT guidelines [10,14] and rates of FEV1 decline prior to and six months after ECP initiation were obtained from the following two data sources:
1. Data from a subset of 60 subjects in a previously published study involving management of BOS with ECP.(Morrell Series) [9].
2. Data from a subset of 44 CMS Registry Series subjects [12,13].
Estimation of time required for ECP to be effective
To assess the time required for ECP to become effective, we compared the change in rate of decline in FEV1 at 6 months prior to enrollment, months 0 – 3 after enrollment and months 3 - 6 after enrollment using data from a subset of the 44 patients CMS Registry Series [12] who had FEV1 data available through six months after enrollment.
Mathematical Modeling of Annual Cumulative Survival
Survival calculations
Survival was calculated using the following parameters:
1. Adjusted baseline FEV1 values based on expected values during BOS surveillance as well as at BOS diagnosis predicated on the time required for BOS diagnosis and the case specific rate of decline.
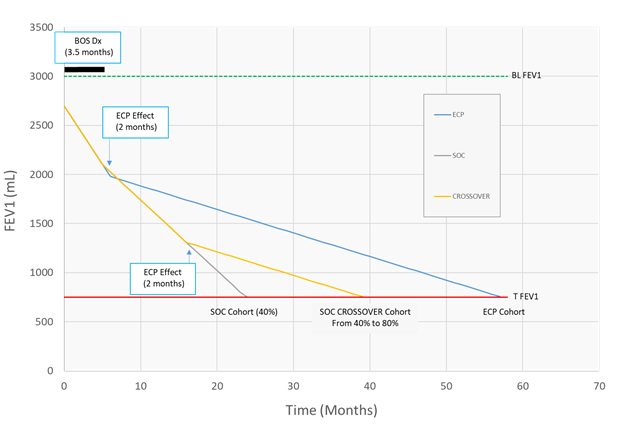
Figure 2:illustrates an example of application of the method used to calculate survival based on pre and post intervention rates of FEV1 decline in three cohorts: ECP, SOC and SOC with Crossover. Data from 60 patients were used for Baseline FEV1 values in all cohorts. Data from this same series was used for pre and post ECP rates of FEV1 decline in ECP treated patients (ECP cohort and and SOC Crossover cohort) while SOC effect on rate of FEV1 was estimated at 40%. Terminal FEV1 (TFEV1) values were determined using data from a series of 60 patients who expired due to end stage pulmonary dysfunction from BOS. The following values were used in this example: Baseline FEV1 = 3000 mL, FEV1 at steady state conditions = 2700 mL (3000 x 0.9), enrollment FEV1 rate of decline = 120 mL/month, TFEV1 = 740 mL. Time required for BOS diagnosis and enrollment was 3.5 months. Time required for achievement of treatment effectiveness were 1 month for SOC and 2 months for ECP. Protocol defined crossover for patients with < 200 mL/month is allowed at 9 months for SOC patients who fail to achieve the spirometric endpoint (> 50% decrease in the FEV1 rate of decline).
2. The effectiveness and time required for effectiveness for respective interventions to attenuate the change in rate of FEV1 decline were as follows: 40% for SOC at enrollment while the case specific effect of ECP was characterized using the decline in FEV1 before and after ECP at two months after enrollment. These values were applied at various times as dictated by the times allocated for intervention effect and the protocol (i.e., after enrollment and at crossover predicated on rate of FEV1 of decline strata at enrollment).
3. Terminal FEV1 as previously defined.
Modifications of equations used in a developed statistical application to generate survival days between the various cohorts are summarized in Supplemental Appendix SIII. In addition, Illustration of an example of survival estimation is illustrated in Figure 2.
Statistical Methods
Chi square and Fischer’s exact test were used to compare categorical variables. Two-sample Wilcoxon rank-sum (Mann-Whitney) was used predominately based on the low number of observations and more common presentation of non-normal distributions. In contrast, to compare mean FEV1 values at baseline and to compare rate of decline in FEV1 immediately prior to ECP initiation (pre-ECP) and at 6 months after initiation of ECP, either two-sample Wilcoxon rank-sum or one-way ANOVA were used predicated on data distribution (i.e., normal vs non-normal). Linear regression analysis was used to characterize the relationship between FEV1 vs time.
The bootstrap method was used to characterize the annual enrollment rates required to detect statistically significant differences in mortality between the SOC-crossover and ECP cohorts over a ten year enrollment period at various power levels (40-100%). For each combination of alpha and recruitment rate, 1000 replicate bootstrap samples were taken with replacement from the 60 subjects with survival projections. For each replicate, subjects were randomly assigned to a treatment group, then Kaplan-Meier survival curves were calculated and tested for homogeneity among treatments using a Wilcoxon test. Power was estimated from the proportion of replicates with p-values smaller than alpha. A p-value of less than 0.05 was considered statistically significant. Statistical analyses were performed using STATA14 software (StataCorp, College Station, TX) and SAS 9.4.
Results
Terminal FEV1 assessments
CMS Registry series data
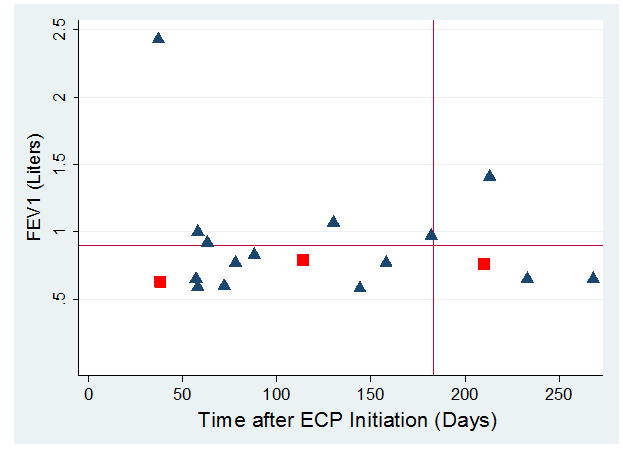
Figure 3:Illustrates the terminal (i.e., most recent FEV1 prior to mortality) FEV1 (L) along the y-axis vs time from start of ECP (days) along x-axis for the 18 subjects who expired in the first 12 months after ECP initiation. The blue triangles represent the 15 ECP arm subjects while the red squares represent the Observation arm subjects who crossed over to ECP treatment. The mean (0.9) FEV1 is demarcated by the horizontal red line while the vertical red line demarcates subjects who had early mortality (i.e., six months after initiation of ECP).
Figure 3 illustrates the terminal FEV1 (L) along the y-axis vs time from start of ECP (days) along x-axis for the 18 subjects who expired in the first 12 months after ECP initiation. Median FEV1 values measured just prior to mortality were 770 mL (IQR: 650 to 930 mL); when one patient with a 2270 mL FEV1 was excluded, the median FEV1 values measured just prior to mortality was 770 mL (IQR: 650 to 920 mL). Of patients who expired within 12 months of ECP initiation, 78% had a TFEV1 less than one liter.
BJH series data
Of 107 charts that were reviewed via the BJH EMR, 47 did not meet the aforementioned eligibility criteria and were excluded as follows: absence of at least 6 months of spirometry data (n=8), no etiology of mortality documented (n=20) and an etiology not related to CLAD (n=19). The median TFEV1 value measured prior to mortality in the remaining sixty patients meeting criteria was 670 mL (IQR: 565 to 860 mL, see Table 1a); of patients who expired within 12 months of ECP initiation, 88% had a TFEV1 less than 730 mL. The median number of days to expiration from the last recorded date FEV1 value was 42 (21-75) days, (Table 1a). The median rate of FEV1 decline in the six months before the TFEV1 was -63 (-15 to -142) mL/month with median r2=0.84 (0.43 – 0.94), median p-value=0.06 (0.01 – 0.16).
Table 1a.Terminal FEV1 values and time to mortality between two patient series. FEV1 values expressed in milliliters. Data expressed as Median (Interquartile Range) in mL.
| CMS ECP study (n=18) compared to | BJH Series (n=60) | P-value* | |
|---|---|---|---|
| Normal FEV1 | 2960 (2490 – 3200) | 2955 (2440 – 3450) | 0.95 |
| Baseline FEV1 | 2720 (2290 – 3410) | 2440 (1980 – 3095) | 0.12 |
| Terminal FEV1 | 770 (650 – 930) | 670 (565 – 860) | 0.1 |
| Time from TFEV1 to death (days) | 30 (15 – 66) | 42 (21 – 75) | 0.39 |
| Adjusted TFEV1 | 633 (501 - 746) | 563 (384 – 755) | 0.48 |
| Adjusted TFEV1¥ | 609 (454 – 764) | 468 (319 – 643) | 0.15 |
*p-value when compared to CMS ECP Study Cohort using two-sample Wilcoxin rank-sum. ¥When comparing TFEV1 only in patients whose FEV1 vs time relationship involved a p-value<0.1 and a negative. slope (rate of FEV1 decline) between CMS (n=15) and Local Series (n=38).
Table 1b summarizes spirometry and time to mortality data between two groups predicated on p values from FEV1 vs time relationships (Group A: p value > 0.1; Group B: p value < 0.1). Lowest FEV1 (LFEV1) values were similar to TFEV1 (Table 1b) while the time to mortality was twice as long when tracking from LFEV1 vs TFEV1 values.
Table 1b.Terminal vs Lowest FEV1 using data from BJH Series (n=60).
Data expressed as Median (Interquartile Range).
| Group A Lowest=Terminal (n=40) | Group B Lowest < Terminal (n=20) | p-value when compared to Group A* | |
|---|---|---|---|
| Lowest 6 month FEV1 (mL) | 645 (530 – 840) | 700 (560- 855) | 0.65 |
| TFEV1 to LFEV1 (days) | 0 (0 – 0) | 38 (21 – 79) | NA |
| LFEV1 to death (days) | 38 (21 to 79) | 127 (65 to 139) | < 0.0001 |
| Rate of FEV1 decline (mL/month) | -78 (-15 to -203) | -6 (8 to -127) | < 0.0001 |
*Use of two-sample Wilcoxin rank-sum
Group A had significantly (p<0.0001) higher (12 times higher) rates of FEV1 decline (see row four of Table 1b) when compared to Group B. The mean rate of FEV1 decline in Group A also involved less data scatter as reflect by higher (p<0.0001) % variance explained (i.e., R-square values) (0.89: 0.8 – 0.97) when compared to Group B (0.41: 0.15 – 0.56). Group A was more likely (p<0.0001) to involve a significant p-value (0.02: 0.001 – 0.07) linear relationship between FEV1 vs time when compared to Group B (0.22: 0.09 – 0.35). The modified (Adjusted) TFEV1 was calculated as 0.58 ± 0.33 L. The adjusted TFEV1 was 468 (319 – 643) mL when modified further (Adjusted TFEV1¥) to include only negative FEV1 vs time slope values with corresponding p values <0.1 (n=38).
Spirometric Analyses: FEV1 and FEV1 rates of decline.
Determination of cutoff for adjustment of baseline FEV1 values
Of 107 subjects in the BJH Series, spirometry results from 37 subjects with at least 5 FEV1 values and a stable FEV1 pattern were utilized for characterization of the variability of FEV1 and % maximum FEV1 values during the surveillance period for BOS. A median and mean % change from maximum FEV1 values of -10% and -13% (Range: 13 to -61%) were observed over the monitoring interval, respectively. One and two standard deviation coefficients of variation of 8.5% and 17% were observed, respectively. Supplemental Figure S1 illustrates the within subject variability between measurement intervals that can be observed during surveillance for BOS; 49% of subjects had at least one % change from maximum value that exceeded 20% from the patient specific maximum value while 25% of all recorded FEV1 % maximum values exceeded 20%.
Spirometry data used for survival analysis
Table 2 summarizes baseline spirometry values, rate of decline in FEV1 prior to and after ECP and the percent change in FEV1 in a subset of cases that met the RCT enrollment criteria and retrievable requisite data from the previously published retrospective series Morrell et al. [9] (n=46) when compared to the CMS registry cohort (n=14). Other than a slightly lower mean baseline FEV1 value in the CMS Registry series, rates of decline and percent change values were similar between the two data sources.
Table 2.Spirometry Values prior to and after ECP, Survival between subsets of patients within two published series. Rates of FEV1 decline in mL/month. Data expressed as Mean ± SD.
| Data Sources | p-value | |||
|---|---|---|---|---|
| All Patients (n=60) | Retrospective Series9 (n=46) | CMS Prospective Registry13 (n=14) | ||
| Baseline FEV1 after Transplant (mL) | 3.1 ± 0.8 | 3164 ± 694 | 2660 ± 906 | 0.06 |
| Pre-ECP Rate of Decline | -152 ± 105 | -150 ± 101 | -159 ± 122 | 0.78 |
| 6 Months Post-ECP Rate of Decline | -33 ± 56 | -31 ± 53 | -39 ± 66 | 0.89 |
| Pre vs Post ECP Rate of Decline (% Δ) | -72 ± 63 | -71 ± 70 | -74 ± 30 | 0.44 |
| RCT Cohort | ECP | SOC | SOCC | |
| Projected Survival (Days) | 3173 ± 3510 | 878 ± 708* | 1724 ± 2004¥ | |
*p=0.001 when compared to ECP Cohort.
¥P=0.001 when compared to ECP Cohort and p=0.0005 when compared to SOC Cohort.
Figure 4 depicts the rate of FEV1 decline (mL/month) using the three time points assessed (up to six months prior to enrollment, months 0 to 3 months after enrollment and months 3 through 6 months after enrollment) in a subgroup of CMS Registry patients. As illustrated, the rate of FEV1 decline decreases linearly up to the last measurement period; however, only rate of decline slope values at months 3-6 were significantly different when compared to the pre-enrollment period (p=0.004). When the analysis is stratified based on enrollment slopes < -100 mL/month (n=8) vs > -100 mL/month (n=8), a trend (p=0.22) for lower % change in slope values (i.e., pre-ECP to months 3-6) in subjects whose slope values are < -100 mL/month was observed when compared to subjects whose slope values were > - 100 mL/month, -74% vs -143%, respectively.
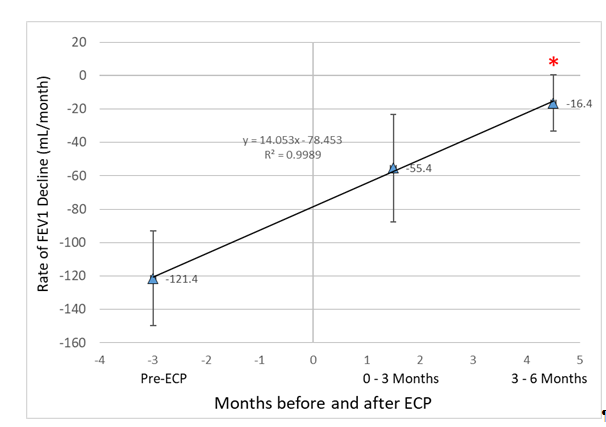
Figure 4:Iillustrates the relationship between the peri-ECP time period and the rate of FEV1 decline (mL/month). *denotes p-value<0.05 when compared to Pre-ECP period.
Cumulative Survival Estimates between RCT cohorts
Using spirometry data (n=60), survival estimates that were projected for the three RCT cohorts (ECP Treatment, SOC treatment and SOC with Crossover to ECP) are illustrated in Figure 5, Table 2, and bottom row. Statistically longer survival was projected for the ECP cohort when compared to both the SOC (260% increase) or SOC with crossover (85% increase) cohorts. Statistically longer (96% increase) survival was also projected for the SOC Crossover cohort when compared to the SOC Cohort.
Survival projections are summarized in Kaplan-Meier Survival Curves for each cohort (Figure 5). Three year survival was projected to be 45% greater in the ECP treatment cohort (58%) when compared to the SOC\C cohort (40%). Figure 6 illustrates annual recruitment estimates at various levels (40-100%) of power.
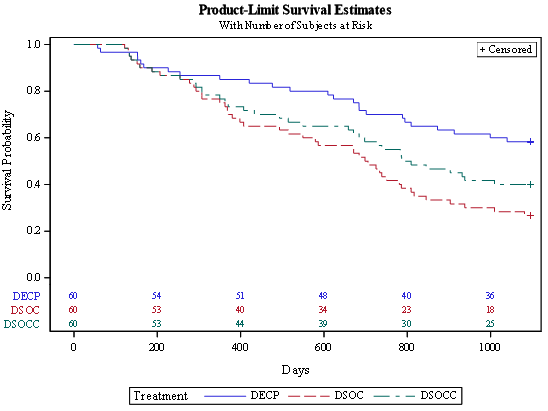
Figure 5:illustrates 3 Year survival between cohorts ECP (DECP), SOC (DSOC) and SOC with crossover to ECP (DSOCC) using a Terminal FEV1 of 740 mL.
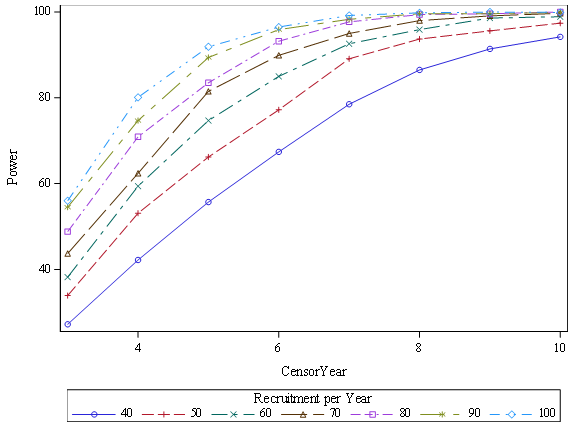
Figure 6:Illustrates Power vs annual recruitment rate over 10 Censor Years with Terminal FEV1 of 740 mL.
Discussion
Our observation of 41% mortality one year after enrollment in the Registry trial, which was related to end stage pulmonary dysfunction in 92% of cases, led to a re-evaluation of our study design. The findings of low FEV1 values at BOS diagnosis and the higher rates of decline in FEV1 in non-survivors revealed from our preliminary analysis of our registry highlights the potential importance of early detection and expedited management of BOS with ECP, even as first line therapy rather than as treatment for refractory disease, to arrest disease progression before lung function reaches a critical level. Timely initiation of ECP for BOS may be achieved via implementation of a more aggressive diagnostic and treatment program. Based on the results of this study [12] and previous publications, [15-18] early detection of BOS should result in better functional status and prolong survival for either primary or refractory BOS. Accordingly, we have expanded our study to now include a randomized arm that involves use of ECP as first line therapy when compared to local standard of care management of BOS, with eligibility predicated on more frequent spirometry monitoring. If ECP enhances survival in individuals with a new diagnosis of BOS, awaiting results of a prolonged trial would result in unnecessary morbidity and mortality in the Medicare population that can only receive ECP under an approved research protocol. As a result, we chose to include a crossover option for patients to receive ECP if they fail SOC management.
The high enrollment requirements (n>700) required for a binary, 3-year mortality after BOS diagnosis led to our development of a sophisticated mathematical model designed to assess the effect of ECP on survival using objective spirometric data predicated on protocol related factors. Two databases were used to estimate a terminal FEV1 of 730 mL that was used in our model since this has not been previously characterized. The adjustment of baseline values by 10% was predicated on our internal data which seemed to have a somewhat higher variability (CV) between serial FEV1 values of 8.5% when compared to 5.7% previously observed [19]. Use of our mathematical model, even with projected crossover of a substantial percentage of SOC patients, revealed that ECP would still result in higher survival after 3 years, with a lower enrollment target of approximately 450 subjects.
However, our model may have limitations. SOC management may vary substantially between enrolling institutions that implement various strategies to surveille for and manage CLAD, and this variability could impact RCT outcomes. Therefore, our estimate of SOC management on rate of FEV1 decline represents the most important limitation of our survival analysis. For that reason, we have decided to confirm our current enrollment projections after we obtain and analyze spirometric data from 100 patients enrolled into the RCT, to evaluate representative average effect of SOC management of BOS on FEV1 rate of decline at all of the enrolling centers.
Although we estimated the time required for ECP to take effect at 2 months (Figure 4), the surrogate nature of this estimation may also represent a limitation. The processing of a limited and variable percentage (5-10%) of the patient’s circulating lymphocytes via the CELLEXTM automated ECP instrument may predispose to variable time requirements for effectiveness based on the number and frequency of ECP procedures performed. Our findings of a smaller %change (74% vs 143%) in the rate of FEV1 decline within months 3-6 after enrollment in patients with rates of FEV1 decline that exceed 100 mL/month indicate that ECP make take longer to have an effect in patients who present with an aggressive form of FEV1 decline. Therefore, it can be speculated that these patients perhaps have a higher burden of activated T helper cells (i.e., activated T helpers) which are mediating a more virulent form of the disease that may require more aggressive management. Increasing the frequency of ECP procedures is logistically problematic. Another alternative to increase the effectiveness of ECP may involve manipulation of the ECP regimen by increasing 8-MOP concentrations which would potentially increase the efficacy of ECP by increasing the extent of lymphocyte apoptosis which is linearly related to 8-MOP concentrations from 50 to 200 ng/mL [20].
Conclusion
Our previous preliminary analysis of the first 44 patients enrolled in the CMS ECP Registry study revealed that diagnosis of BOS in current state requires a prolonged period of assessment, leading to initiation of treatment at late stage, and as a result high early mortality rates. These findings prompted us to revise our study to enable earlier detection and treatment of BOS and to modify the trial to include a RCT component. Analyses performed in the current study have formed the basis for our mathematical spirometric model to be used to quantify the effectiveness of ECP with respect to cumulative annual survival and to project enrollment requirements. Our study also provides new and novel elements, such as characterization of TFEV1 and projection of survival based on spirometric parameters that may be useful in future studies to assess the efficacy of interventions designed to attenuate or arrest the decline in lung function related to BOS.
Acknowledgements
Funding
Funded by Therakos®, Inc., a Mallinckrodt Pharmaceuticals company (NCT02181257). The U.S. Centers for Medicare and Medicaid Services (CMS) reimbursed costs of extracorporeal photopheresis therapy for enrolled participants in this CMS-approved study under its Coverage with Evidence Development authority (CAG-00324R2).
Authorship Participation
Hilary Goldberg, MD: Participated in performance of the research, enrollment of patients, writing, review and editing of the paper; Chadi Hage MD:Participated in performance of the research, enrollment of patients, review and editing of the paper; Julia Klesney-Tait, MD: Participated in performance of the research, enrollment of patients, review and editing of the paper; Keith Wille, MD: Participated in performance of the research, enrollment of patients, review and editing of the paper; Selim Arcasoy, MD: Participated in performance of the research, enrollment of patients, review and editing of the paper; Gordon Yung, MD: Participated in performance of the research, enrollment of patients, review and editing of the paper; Marshall Hertz, MD: Participated in performance of the research, enrollment of patients, review and editing of the paper; Kevin Chan, MD: Participated in performance of the research, enrollment of patients, review and editing of the paper; Matt Morrell, MD: Participated in performance of the research, enrollment of patients, review and editing of the paper; Suresh Vedantham, MD: Participated in research design, editing of the paper ; Clare Derfler, RN: Participated in performance of the research, review and editing of the paper; Paul Commean, BEE: Participated in data management, performance of the research, review and editing of the paper; Roger Yusen, MD: Participated in guidance for data analysis, editing of the paper; Michael Walldendorf PhD: Participated performance of the research, in editing of the paper, data analysis; Elizabeth Staley MD: Participated in data collection, performance of the research, review and editing of the paper; Alyssa Despotis: Participated in data collection, performance of the research, review and editing of the paper; Jacob Linker: Participated in data collection, performance of the research, review and editing of the paper; Jeff Atkinson, MD: Participated in review and editing of the paper; George Despotis, MD: Participated in research design, performance of the research, data analysis, writing of the paper.
Disclosure of Potential Conflict of Interest: Relationships with entities related to the topic listed below:
Hilary Goldberg, MD - Subcontract for CMS and Therakos, Inc sponsored study; Chadi Hage, MD – None; Julia Klesney-Tait, MD – None; Keith Wille, MD – None; Selim Arcasoy, MD, MPH – None; Gordon Yung, MD – Financial interest that exceeds $5000 with Industry sponsor; Marshall Hertz, MD – None; Kevin Chan, MD – None; Matt Morrell, MD - None; Suresh Vedantham, MD – Investigator of study funded by both Medicare and Therakos/Mallinckrodt (outlined above); Mary Clare Derfler RN – Project Leader of study funded by both Medicare and Therakos/Mallinckrodt (outlined above); Paul Commean, BEE – Investigator of study funded by both Medicare and Therakos/Mallinckrodt (outlined above); Roger Yusen, MD – Investigator of study funded by both Medicare and Therakos/Mallinckrodt (outlined above); Michael Wallendorf, PhD – Statistician of study funded by both Medicare and Therakos/Mallinckrodt (outlined above); Elizabeth Staley MD – None; Alyssa Despotis – None; Jacob Linker – None; Jeff Atkinson, MD – None; George Despotis, MD – PI of study funded by both Medicare and Therakos/Mallinckrodt (outlined above).
References
1. Verleden GM, Glanville AR, Lease ED, et al. Chronic lung allograft dysfunction: Definition, diagnostic criteria, and approaches to treatment-A consensus report from the Pulmonary Council of the ISHLT. J Heart Lung Transplant. 2019;38(5):493-503.
2. Yusen RD, Edwards LB, Kucheryavaya AY, et al. The Registry of the International Society for Heart and Lung Transplantation: Thirty-second Official Adult Lung and Heart-Lung Transplantation Report--2015; Focus Theme: Early Graft Failure. J Heart Lung Transplant. 2015;34(10):1264-1277.
3. Slovis BS, Loyd JE, King LE. Photopheresis for chronic rejection of lung allografts. N Engl J Med. 1995;332(14):962.
4. O’Hagan AR, Stillwell PC, Arroliga A, et al. Photopheresis in the treatment of refractory bronchiolitis obliterans complicating lung transplantation. Chest. 1999;115(5):1459-1462.
5. Salerno CT, Park SJ, Kreykes NS, et al. Adjuvant treatment of refractory lung transplant rejection with extracorporeal photopheresis. J Thorac Cardiovasc Surg. 1999;117(6):1063-1069.
6. Villanueva J, Bhorade SM, Robinson JA, et al. Extracorporeal photopheresis for the treatment of lung allograft rejection. Ann Transplant. 2000;5(3):44-47.
7 . Benden C, Speich R, Hofbauer GF, et al. Extracorporeal photopheresis after lung transplantation: a 10-year single-center experience. Transplantation. 2008;86(11):1625-1627.
8. Jaksch P, Scheed A, Keplinger M, et al. A prospective interventional study on the use of extracorporeal photopheresis in patients with bronchiolitis obliterans syndrome after lung transplantation. J Heart Lung Transplant. 2012;31(9):950-957.
9. Morrell MR, Despotis GJ, Lublin DM, et al. The efficacy of photopheresis for bronchiolitis obliterans syndrome after lung transplantation. J Heart Lung Transplant. 2010;29(4):424-431.
10. Estenne M, Maurer JR, Boehler A, et al. Bronchiolitis obliterans syndrome 2001: an update of the diagnostic criteria. J Heart Lung Transplant. 2002;21(3):297-310.
11. CMS Transmittal.
12. CMS Protocol Number CAG-00324R2; ClinicalTrials.gov identifier: NCT02181257.
13. Hage CA, Klesney-Trait J, Wille K, et al. Extracorporeal photophersis to attenuate decline in lung function due to refractory obstructive allograft dysfunction. Transfusion Med 2021 In Press.
14. Meyer KC, Raghu G, Verleden GM, et al. An international ISHLT/ATS/ERS clinical practice guideline: diagnosis and management of bronchiolitis obliterans syndrome. Eur Respir J. 2014;44(6):1479-1503.
15. Bjørtuft O, Johansen B, Boe J, et al. Daily home spirometry facilitates early detection of rejection in single lung transplant recipients with emphysema. Eur Respir J. 1993;6(5):705-708.
16. Kugler C, Fuehner T, Dierich M, et al. Effect of adherence to home spirometry on bronchiolitis obliterans and graft survival after lung transplantation. Transplantation. 2009;88(1):129-134.
17. Finkelstein SM, Scudiero A, Lindgren B, et al. Decision support for the triage of lung transplant recipients on the basis of home-monitoring spirometry and symptom reporting. Heart Lung. 2005;34(3):201-208.
18. Wagner FM, Weber A, Park JW, et al. New telemetric system for daily pulmonary function surveillance of lung transplant recipients. Ann Thorac Surg. 1999;68(6):2033-2038.
19. Martinez JA, Paradis IL, Dauber JH, et al. Spirometry values in stable lung transplant recipients. Am J Respir Crit Care Med. 1997;155(1):285-290.
20. Wolnicka-Glubisz A, Fraczek J, Skrzeczynska-Moncznik J, et al. Effect of UVA and 8-methoxypsoralen, 4, 6, 4’-trimethylangelicin or chlorpromazine on apoptosis of lymphocytes and their recognition by monocytes. J Physiol Pharmacol. 2010;61(1):107-114.
Received: April 20, 2021;
Accepted: May 07, 2021;
Published: May 18, 2021.
To cite this article : Goldberg H, Hage C, Klesney-Tait J, et al. Evolution of a Pivotal Clinical Study to Evaluate Extracorporeal Photopheresis for Refractory Bronchiolitis Obliterans. European Journal of Respiratory Medicine. 2021; 3:1.
© 2021 The EPI Study Group.
