
Research Article/ Open Access
DOI: doi: 10.31488/EJRM.117
The Use of End-Tidal CO2 as a Screening Tool in Patients with Pulmonary Embolism
Mojgan Najafzadeh*3, Imad Riaz1, Jonathan Walker2, Hassan Ugail4, Andrew Scally4, Badie Jacob⃰1
1.Bradford Teaching Hospitals NHS Foundation Trust, Bradford Royal Infirmary, Duckworth Lane, BD9 6RJ
2.Calderdale and Huddersfield NHS Foundation Trust, Calderdale Royal Infirmary, Halifax HX3 0PW
3.School of Life Sciences, University of Bradford, Bradford, BD7 1DP, UK
4.Centre for Visual Computing, School of Engineering and Informatics, University of Bradford, Bradford, BD7 1DP, UK
5.School of Clinical Therapies, University College Cork, Gaol Walk, Cork, Ireland, T12 YN60
*Corresponding author: Prof Badie Jacob, Respiratory Consultant and Senior Lecturer, Bradford Teaching Hospitals Foundation NHS Trust, Duckworth Lane,Bradford West Yorkshire, BD9 6RJ and Dr Mojgan Najafzadeh, Lecturer and Medical Research Fellow, Biochemistry and Biosciences Department University of Bradford, Richmond Building, Richmond Road, BD7 1DP Bradford, UK
Abstract
Objective: End-tidal CO2 (ETCO2) can represent dead space ventilation. We aimed to define the optimum ETCO2 to exclude a pulmonary emboli (PE) event conclusively. Methods: 479 consecutive patients with suspected PEs were enrolled over 3 years in 2012-2014 and 2019. Symptoms, demographic data, Well's score, D-dimer levels and the gold standard computed tomography pulmonary angiogram (CTPA) results were collected for analysis. ETCO2 was measured within 24 hours of presentation in all 479 patients. Results: Patient age ranged from 18 to 93 years. PE was diagnosed in 25% of cases. The average ETCO2 in patients with a positive CTPA was 24.99 mmHg (range 16- 32 mmHg, SD98.25). The average ETCO2 in patients without a PE was 32.53 mmHg (range 17- 49.5.5 mmHg, SD 3.8). All but 14 patients positive for a PE obtained an ETCO2 of 32.5 mmHg. This point 32.5 had a sensitivity and specificity (98.6 % and 64.6 %, respectively) with a negative predictive value of 98.8 % and a positive predictive value of 60%. Conclusion: ETCO2 may reliably be used to screen and exclude patients with suspected PEs. If used in combination with D-dimer with clinical probability as a screening tool, CTPA will be required only in a minority of patients.
Keywords: ETCO2, pulmonary embolism, D-dimer, CTPA
Introduction
Pulmonary Embolism (PE) is a global problem and a leading cause of cardiovascular death in the western world and a major public health problem [1,2]. The diagnosis of PE remains a challenge because of the high variability in clinical presentation complex interplay between different organs. Patients can present with chest pain, dyspnoea, haemoptysis, syncope and hypoxaemia [3,4]. Diagnosis of a PE is confirmed in <25% of patients that are clinically suspicious and the radiological investigations are essential [5,6]. Despite the low relative incidence of the disease, there is a significant rise in the number of patients undergoing unnecessary computed tomography pulmonary angiograms (CTPA) to exclude a PE. Moreover, the CTPA is the most robust predictive evidence base for adverse clinical outcomes in patients with acute PE [7,8].
In most centres, patients with a high clinical suspicion of PE undergo serum D-dimer assessment as a screening test and it has a value in ruling out PE [9, 10]. Treatment is initiated on those with a positive D-dimer and continuation of treatment is determined by the outcome of the CTPA scan [9]. Measurement of serum D-dimer requires venipuncture and results are not immediate [9]. CTPA scans are associated with high cost and exposure to radiation and nephrotoxic contrasts, a worrying concept with their increasing use [7, 8, 11, 12]. It has been proposed that the Wells score can be used as a safe, quick and straightforward means of determining clinical suspicion [13, 14]. End-tidal carbon dioxide (ETCO2) is a simple bedside test with the ability to exclude PE in patients who do not have it. While not overlooking true-positive cases, they will avoid; unnecessary venipunctures, exposure to radiation, and contrast medium and user bias.
The Ventilation-perfusion measurement is the most critical mechanism affecting the efficiency of pulmonary gas exchange. Also, the assessment for alveolar dead space ventilation and ETCO2 as surrogates for pulmonary vascular obstruction has been proposed as a valuable screening tool for excluding PEs. PEs result in the formation of a lung compartment that is ventilated but not perfused, resulting in dead space ventilation [15, 16]. Increased alveolar dead space prevents adequate gas exchange, yielding a low alveolar CO2 content, which can be measured at end-expiration using a handheld capnograph by the bedside. Conditions like angina that have a similar clinical presentation to a PE do not increase alveolar dead space. Pathologies that increase alveolar dead space, such as end-stage chronic pulmonary obstructive disease, can be easily differentiated from a pulmonary embolic event. The size of alveolar dead space has been approximated by measuring the CO2 arterial tension to end-tidal CO2 gradient as a percentage of the ventilated but not perfused lung. Therefore, the PE diagnosis is mainly based on assessing clinical pretest probability, D-Dimer measurement and imaging tests, primarily CTPA [17, 18]. ETCO2 determination may be used in isolation as a simple bedside test where measuring exhaled gas and alveolar-arterial gradient requires arterial blood gas sampling and specialised equipment. Previous studies have shown that ETCO2 is a reliable screening tool when combined with bedside prediction in excluding PE [19, 20]. We hypothesise that a high ETCO2 can be used in isolation as a reliable screening tool to exclude PE in patients, avoiding the unnecessary need for a CTPA.
Materials and Methods
This prospective study was performed at the Bradford Teaching Hospitals, Bradford, United Kingdom. The aim of our study was to investigate the role of ETCO2 as a screening tool in the diagnosis of PE. Inpatients and patients admitted to the acute medical assessment unit (AMAU) or other departments suspected of having PE were enrolled over a 3 year period from 2012-2014 and 2019. Clinical suspicion was based upon a high Wells score or a positive plasma D-dimer. In patients where the clinician highly suspected a PE, a CTPA scan was requested without D-dimer determination. In others, a CTPA was requested only if the D-dimer was positive. The radiology department was contacted daily to seek patients who had a CTPA scan requested. The CTPA scan results were taken as the gold standard in diagnosing a PE. Only those patients who had a CTPA scan requested were approached for consent to undergo ETCO2 determination. Levels of ETCO2 were obtained within 24 hours of the onset of symptoms or CTPA. Exclusion criteria included invasive ventilation, pregnancy, inability to consent, known type 2 respiratory failure, oxygen therapy of more than 4 L.min-1 and neuromuscular disorders. The 582 patients were initially screened. 35 patients were excluded as their ETCO2 levels were obtained 24 hours post-onset of their symptoms or CTPA and 32 individuals had minor issues in their consent forms. No patients were enrolled multiple times. Demographic data were collected from medical notes. All patients had a detailed medical history taken. This included smoking status and comorbidities. Wells score was obtained from the medical notes as calculated by the admitting doctor. If 'the patient's physician requested a plasma D-dimer test, the results were recorded. This study in no way interfered with the management of our patient group.
After obtaining informed consent, ETCO2 was measured by trained testers (I.Riaz,B.Jacob, M.Najafzadeh) who were blinded to the diagnosis after obtaining informed consent. Nellcor N85 handheld capnograph/pulse oximeter and CapnostreamTM 35 Portable Respiratory MonitorPM35MNwith Microstream ETCO2 and Nllcor TM SPO2 Medtronic were the devices used to record the ETCO2 values. The capnograph was calibrated every 4 weeks at two levels of CO2 by the medical physics department (Bradford Royal Infirmary, Bradford, UK) calibrated to zero and 5.6% of CO2. The plastic tubing with an uptake mouth cannula (Covidien Oridion Microstream Filter Line Set, Adult/Paediatric CO2 Sampling Line) was placed in the subject's mouth, allowing tidal breathing while ETCO2 was measured. The nostrils were not clipped shut. Patients were instructed to breathe normally for 10 seconds. This was repeated three times and an average ETCO2 value was recorded. No adverse events were noted when obtaining ETCO2 values. The majority of the CTPA scans were placed within 48 hours of admission, and the results were noted.
Data analysed using logistic regression models with PE status, as confirmed by the CTPA scan, as the outcome measure and individual test scores as the predictors.
Receiver operator analysis was then performed for each test individually, and a classification table was produced for a range of thresholds for both ETCO2 and D-dimer. Receiver operating curves (ROC) with an area under the curve (AUC) was used for determining the optimal ETCO2 to discriminate between patients with and without a PE. P-values of ≤0.05 were considered statistically significant. All analyses were conducted using Stata 12 (StataCorp.2011 Stata release 12, statistical software, College Station, TX: Stata Corp LD).
Results
A total of patients (264 females and 215 males) were included in the study. Patient age ranged from 18 to 93. 479 patients were included in the final analysis. 136 patients (25.3%) were diagnosed with a PE on CTPA scanning. No patients were enrolled twice. Three hundred and sixteen patients were enrolled from the AMAU with 82 PEs, and 221 were inpatients with 54 PEs. Altogether, 537 patients were enrolled which some of the patients were excluded from the study due to not meeting the study’s criteria. All patients had a detailed medical history taken. This included smoking status and comorbidities. The comorbidities were listed as diabetes melitus type 2, Asthma, Infectious disease, Cardiovascular diseases, Cancer, autoimmune diseases, COPD and other respiratory diseases, Interavenus drug users (IVDU), Reduce mobility and coagulation diseases.
A high proportion of patients diagnosed with a PE also had multiple comorbidities (50%) compared to the non-PE group (23%). Furthermore, 58% of obese patients and 86% of cancer patients had a PE. It was noted that the average age of those who had a PE was 58.9 compared to the non-PE group at 56.9. 38% of males recruited experienced a pulmonary embolic event compared to 31% of females. 34% of past smokers and 48% of current smokers suffered a PE compared to 30% with no smoking history. There was no difference in the presence or absence of medical comorbidities in the two groups.
The mean Wells score was 3.8 (range: 0-10) in the PE group and 3.0 (range: 0-10.5) in the non-PE group. Figure 1 demonstrates that the AUC (Area Under Curve) for Wells score is 0.59.
431 out of the 479 patients had their plasma D-dimer levels measured. Serum D-dimer in this centre was positive if 275 μg/L or above and is measured via the use of monoclonal antibodies coupled to latex beads. All patients with a PE had positive D-dimer. 72% of patients that did not have a PE had a positive D-dimer result. Mean D-dimer in the PE positive and negative groups was 1,855 μg/l (range 289–6,899 μg/l) and 609 μg/l, respectively (range:a range of 322- 8836 μg/l. ) (range: 44-4137 μg/L), respectively. A ROC curve and the corresponding sensitivities and specificities are shown in figures 1 . The AUC is 0.85. Figure 2 shows D-dimer value of 275 μg/L is 100% sensitivity with a 100% negative predictive value (NPV) but only has 27% specificity. Specificity increases with an increasing D-dimer with a compromise in sensitivity and NPV. D-Dimer value of 450 μg/L has a high sensitivity (96%) and specificity (56%) with an NPV of 96%.
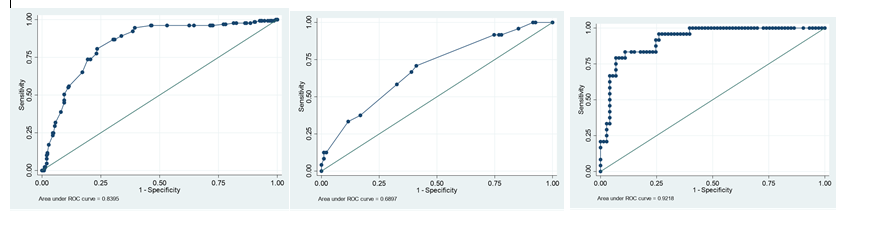
Figure1:The Number of observations: n = 479 . The left side graph is the ROC curve for ETCO2 = 0.8395, the middle graph is the ROC curve in Well’s score which is 0.59 the area under curve and the right side graph is the ROC curve fir D-dimer. 1.c. Although ETCO2 has reasonably good predictive power, d-dimer performs statistically significant with a larger area under the ROC curve
There was no significant difference noted among the three 10-second breathing intervals for the ETCO2 readings. The average ETCO2 in patients with a positive CTPA was (=25.0 mmHg, range: 1.9-4.8 kPa, SD of 0.56). The average ETCO2 in patients without a PE was 32.53 (range 17- 49.5.5 mmHg, SD 3.8). The ROC curve demonstrating the ability of ETCO2 to discriminate between patients with and without PE and the corresponding sensitivities and specificities are shown in figure 1 (AUC is 0.88). All but 14 patients negative for PEs obtained an ETCO2 of >32.5 mmHg. This point (32.5 mmHg)had a sensitivity and specificity (98.6 % and 64.6 %, respectively) with a negative predictive value of 98.8 % and a positive predictive value of 60%.
The 32.53 mmHg is the lowest point where the sensitivity and NPV become 96% yet maintain a high specificity (Sp = 68%). Also, the Only 14 patients with a PE had an ETCO2 greater than 32.53 mmHg. This is demonstrated clearly in figure 2.
Six patients negative for a PE obtained ETCO2 reading below 20 mmHg (Figure 2). Thus, the 10% cut-off corresponded to an ETCO2 of 34.2 (Sn=96%; Sp=37%).
Discussion
Our study has demonstrated that ETCO2 is a quick, safe, reliable and non-invasive bedside screening test in excluding PEs. Furthermore, this study shows that out of the 136 patients with a PE, only 14 patients obtained an ETCO2 value of 32.53 mmHg (Figure 2).
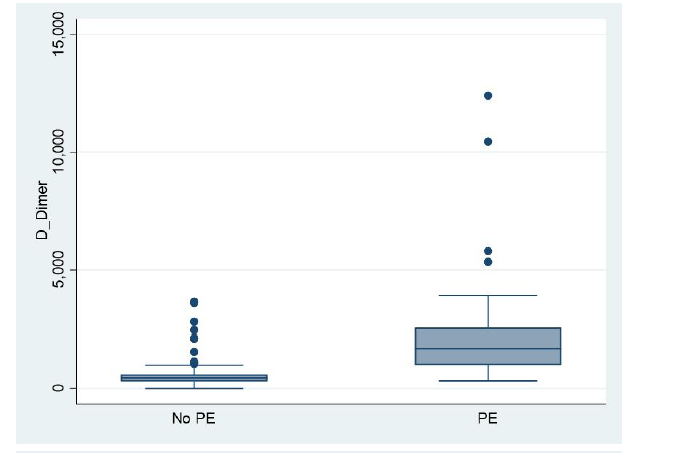
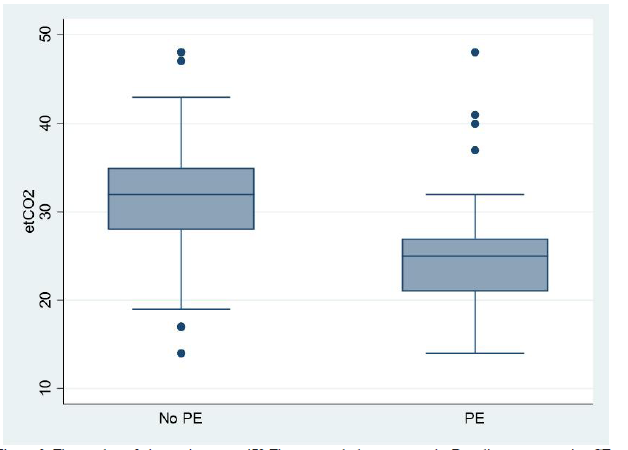
Figure2:The number of observations n = 479 The top graph demonstrates the Box diagram comparing CTPA- positive and CTPA-negative results for D-dimer the below Box diagram comparing CTPA-positive and CTPA- negative results for ETCO2. The line represents a threshold of 32.53 mmHg. This figure shows that no patient with an ETCO2 32.53 had a pulmonary embolism. CTPA = computed tomography pulmonary angiogram; ETCO2 = end-tidal carbon dioxide
In a similar larger study of 298 patients, Hemnes et al. underwent ETCO2 determination within 24 hours of diagnostic imaging [19]. His results with a cut-off of 36 mmHg achieved sensitivities of 87%, specificity of 53%, with a 97% NPV. Our results with a much lower cut-off (32.53 mmHg),demonstrates sensitivity, specificity and NPVs of 96.12%, 64.6% and 98.8%, respectively (Table 1). Our study has a lower cut-off with a higher NPV. This may have been the consequence of a smaller study group and determination of ETCO2 within 24 hours of symptom onset. Studies have shown that prolonged heparin administration reduces the clinical effectiveness of screening tests for PE as the proportion of false-negative results increases [21, 22]. Delay in ETCO2 determination could mean a longer course of treatment hence a potential reduction in alveolar dead space ventilation and clot burden [17, 23].
The assessment of alveolar dead space ventilation and expired CO2 acts as surrogates of pulmonary vascular obstruction. This model has been proposed as vital in excluding pulmonary embolic events [15, 24]. The three-compartment lung model can be used to demonstrate this phenomenon; an ideal compartment which is both ventilated and perfused, a shunt compartment that is only perfused and the alveolar dead space which is only ventilated. The V'A/Q' mismatch could be developed in either shunt and low V'A/Q' regions which are the most frequent causes of hypoxaemia [15, 25]. The size of the alveolar dead space can be estimated by ETCO2 determination.
In 170 ambulatory patients, Kline et al. obtained 100% sensitivity and 65% specificity in excluding PEs with a combination of alveolar dead space fraction (VD/VT) and a negative D-dimer [26, 27]. In a larger study (246 patients) Roger et al. obtained a sensitivity of 80% and a specificity of 70% with VD/VT in excluding PEs [27]. The combination of the VD/VT fraction with a D-dimer improved sensitivity to 98% (27). Our study obtained the same sensitivity at 96.12% and 69.7% specificity with ETCO2 determination alone (Table 1), without requiring specialised equipment or arterial puncture. All but one of our patients with a negative D-dimer and ETCO2 ≥32.53 mmHg were negative for a PE.
Table 1.End-tidal carbon dioxide (ETCO2) classification table over a range of cut-off thresholds
| ETCO2 | Predictive N=4679 | Sensitivity | Specificity | Positive predictive value | Negative predictive value |
|---|---|---|---|---|---|
| 24.1 | >=50% | 44.96% | 90.57% | 63.74% | 81.70% |
| 29.1 | >=25% | 86.82% | 69.71% | 51.38% | 93.49% |
| 34.2 | >=10% | 96.12% | 37.43% | 36.15% | 96.32% |
It was noted that in larger studies, the prevalence of PEs was lower when compared to our study at 35% (28-30). A study with 1177 patients had a prevalence of 17% [13]. Perrier et al. using a cut off value of 500 μg/L for D-dimer, obtained sensitivities of 99.5% and specificity of 41% (NPV 99%) [28, 30]. We obtained similar values using 450 μg/L with marginally lower sensitivity (96%) but much better specificity (53%). These results also correspond to similar studies with varying classification values depending upon the threshold chosen for a positive D-dimer [29]. Similarly, as D-dimer values increase, sensitivity is compromised with a rise in specificity (Figure 3). The threshold used for D-dimer by our centre obtained 100% sensitivity but only 27% specificity. A retrospective study of 220 patients showed that only 4.2% of patients with an elevated D-dimer value were diagnosed with a PE [31]. Tests ordered based on the elevated D-dimer were billed for >$200,000 [31]. In our study, only 42% of patients with a positive D-dimer had a PE. Out of the 130 patients who did not have a PE on CTPA, 80 patients had an ETCO2 greater than 32.53 mmHg. This equated to 62% of the Non-PE population. In Bradford Teaching Hospitals, the cost of a CTPA ranges from £300-500. If our patient population was screened using ETCO2 alone, this could have potentially saved £24,000-£40,000. In the Bradford teaching hospital, around 850 CTPA are done yearly and adoption of our screening method can cut costs significantly.
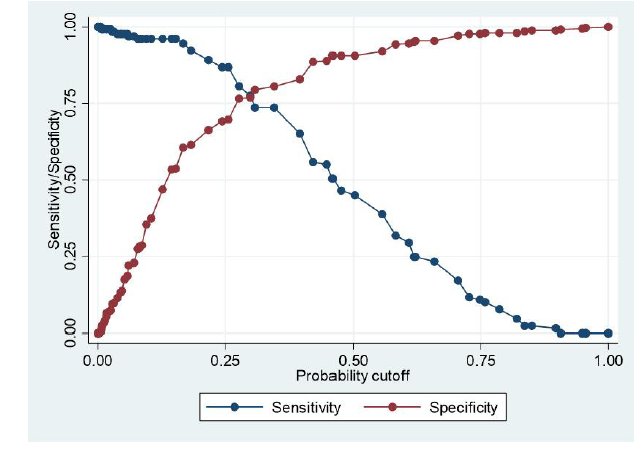
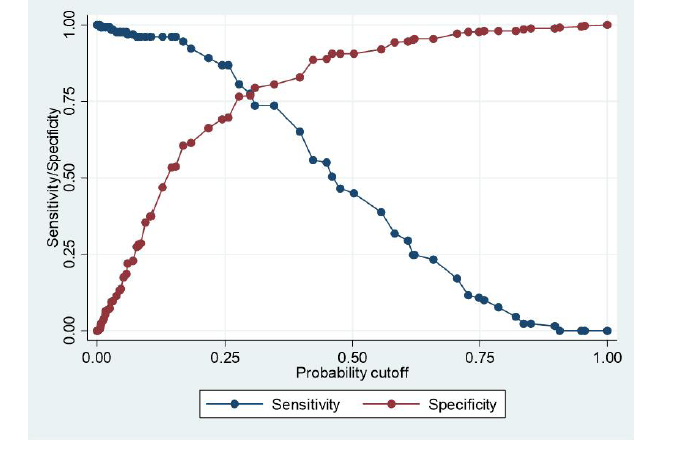
Figure3:The number of observations = 479, Receiver operator curves for (a) D-dimer and (b ETCO2. Plot of the true-positive rate against the false-positive rate for the different possible cut-off points for these diagnostic tests. The area under the curve for D-dimer and ETCO2 are 0.82 and 0.84 respectively. ETCO2 = end-tidal carbon dioxide. ROC = receiver -operating curve
A 32.53 mmHg cut-off for ETCO2 has a much higher specificity (65%) than a plasma D-dimer with the same sensitivity value (100%). Determination of plasma D-dimer requires venous access and results are not immediate. Heparin administration can also reduce the usefulness of D-dimer results as the rates of false positives are increased [21, 32]. If both tests are combined in excluding PEs, sensitivity remains high, but specificity values fall dramatically [28, 29, 32]. It is therefore noted that ETCO2 in isolation has better screening potential when compared with D-dimer (Figure 4).
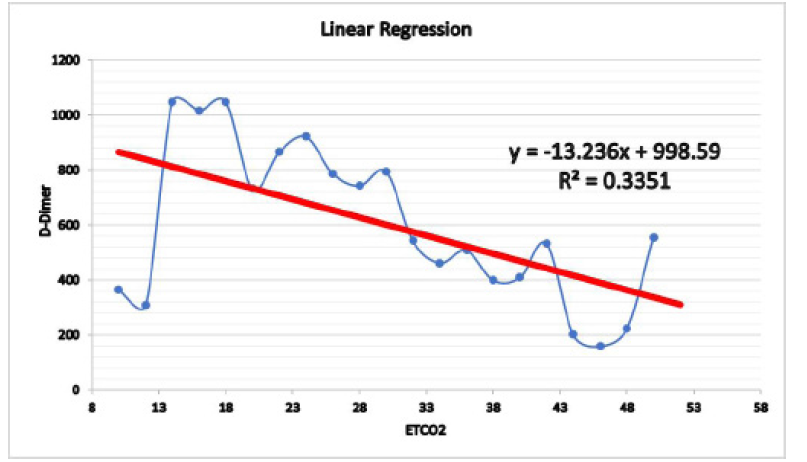
Figure4:The Linear Regression graph, it shows the level of ETCO2 in different patients compared to the D-Dimer results
Wells Score as a screening tool in our study did not exhibit conclusive results. However, other studies show that Wells Score has a moderate to substantial risk stratification ability when diagnosing PE [13, 14]. Hemnes et al. also demonstrated a wells score of <4 when combined with an ETCO2 of >36mmHg increased NPV from 96.6% to 97.6% [19].
It is established that increasing age, multiple comorbidities and male sex increases the probability of a pulmonary embolic event [33-35]. This may be related in part to increased activation of blood coagulation, fibrinolysis, and inflammation, possibly related to the increased inflammatory burden of both atherosclerotic and non-vascular disease. These increases also have implications for the diagnosis of suspected acute venous thrombo-embolism (D-dimer) [33, 36]. There has been a clear link already established between smoking and increased risk of pulmonary embolism [37, 38]. Our data shows that 60% of patients who experienced a PE had a smoking history, compared to 49% in the non-PE group. The mean ETCO2 in our non-PE group is lower (34 mmHg) when compared to Hemnes et al's finding (36 mmHg) [19] . In our study, a much more significant proportion of patients in the non-PE group suffered from chronic lung diseases (15%) compared to Hemnes et al (2.7%). Exacerbation of such conditions can increase the respiratory rate, therefore, can reduce the ETCO2.
The incidence of PEs, based on 37,892 Pennsylvania residents, increased by 0.004%, whilst there was a 21.6% increase in patients undergoing CTPA scans for the same 4 year period [7]. Patients are exposed to high levels of radiation despite the low prevalence [11, 12, 39]. This may be due to the increasing role of defensive medicine and partially because physicians underestimate the radiation dose associated with a CT scan [11, 12, 39]. In a study, 91% of Emergency physicians and 53% of Radiologists did not believe that CT scans increased the lifetime risk of cancer [11]. Contrast material administered during a CTPA scan increases the risk of nephrotoxicity by 9% in those patients that are diabetic or have pre-existing renal insufficiency [40, 41]. In our study, 10% of patients that had a CTPA had diabetes and 3% had renal impairment.
Our study included a combination of inpatients and AMAU patients to capture the complete population perceived to be at risk of a PE. Determination of ETCO2 within 24 hours of symptom onset may be why we obtained a lower threshold of ETCO2 in excluding PE's compared to previous studies [19]. ETCO2 can be abnormal in certain conditions. Exclusion criteria included Patients on non-invasive ventilation, oxygen therapy of more than 4 L.min-1, pregnancy, known type 2 respiratory failures and neuromuscular disorders. In retrospect, recruitment of a control group would have allowed us to capture the ETCO2 trend amongst the normal population. This, coupled with larger sample size, would have allowed for better comparison with previous studies. It would have also been beneficial if the individual determining the ETCO2 for each patient also calculated the Wells score. All these measures would have allowed better comparison between these three screening tools in isolation and combination.
Conclusion
This study highlights that ETCO2 is a quick, safe, reliable and non-invasive bedside test that can be used to screen and exclude patients with suspected PEs. Furthermore, if used in combination with D-dimer with clinical probability as a screening tool (figure 4), CTPA will be required only in a minority of patients.
Abbreviation
PE: Pulmonary Embolism; TRCO2: End -Tidal Carbon dioxide; CTPA: Computed Tomography Pulmonary Angiogram; AMAU: Acute Medical Assessment Unit.
Acknowledgement
The authors thank Medtronic Company for its valuable contribution in supporting this research. Medtronic provided all the devices (10 Capnostream 35 portable respiratory monitor systems) for this study.
Conflicts of Interest
"The authors declare no conflict of interest."
Reference
1. Anderson FA Jr, Wheeler HB, Goldberg RJ, et al. A population-based perspective of the hospital incidence and case-fatality rates of deep vein thrombosis and pulmonary embolism. The Worcester DVT Study. Arch Intern Med. 1991; 151: 933-938.
2. Heit JA, Spencer FA, White RH. The epidemiology of venous thromboembolism. J Thromb Thrombolysis. 2016; 41: 3-14.
3. Tapson VF. Acute pulmonary embolism. N Engl J Med. 2008; 358: 1037-1052.
4. Morrone D, Morrone V. Acute Pulmonary Embolism: Focus on the Clinical Picture. Korean Circ J. 2018; 48: 365-381.
5. Carson JL, Kelley MA, et al. The clinical course of pulmonary embolism. N Engl J Med. 1992; 326: 1240-1245.
6. Hepburn-Brown M, Darvall J, Hammerschlag G. Acute pulmonary embolism: a concise review of diagnosis and management. Intern Med J. 2019; 49: 15-27.
7. DeMonaco NA, Dang Q, Kapoor WN, et al. Pulmonary embolism incidence is increasing with use of spiral computed tomography. Am J Med. 2008; 121: 611-617.
8. Meinel FG, Nance JW, Jr, Schoepf UJ, et al. Predictive Value of Computed Tomography in Acute Pulmonary Embolism: Systematic Review and Meta-analysis. Am J Med. 2015; 128: 747-759 e742.
9. Di Nisio M, Squizzato A, Rutjes AW, et al. Diagnostic accuracy of D-dimer test for exclusion of venous thromboembolism: a systematic review. J Thromb Haemost. 2007; 5: 296-304.
10. Crawford F, Andras A, Welch K, et al. D-dimer test for excluding the diagnosis of pulmonary embolism. Cochrane Database Syst Rev. 2016: CD010864.
11. Brenner DJ, Hall EJ. Computed tomography--an increasing source of radiation exposure. N Engl J Med. 2007; 357: 2277-2284.
12. Coche E, Vynckier S, Octave-Prignot M. Pulmonary embolism: radiation dose with multi-detector row CT and digital angiography for diagnosis. Radiology. 2006; 240: 690-697.
13. Wolf SJ, McCubbin TR, Feldhaus KM, et al. Prospective validation of Wells Criteria in the evaluation of patients with suspected pulmonary embolism. Ann Emerg Med. 2004; 44: 503-510.
14. Posadas-Martinez ML, Vazquez FJ, Giunta DH, et al. Performance of the Wells score in patients with suspected pulmonary embolism during hospitalization: a delayed-type cross sectional study in a community hospital. Thromb Res. 2014; 133: 177-181.
15. Riley RL, Cournand A. Ideal alveolar air and the analysis of ventilation-perfusion relationships in the lungs. J Appl Physiol. 1949; 1: 825-847.
16. Hopkins SR. Ventilation/Perfusion Relationships and Gas Exchange: Measurement Approaches. Compr Physiol. 2020; 10: 1155-1205.
17. Robin ED, Julian DG, Travis DM, et al. A physiologic approach to the diagnosis of acute pulmonary embolism. N Engl J Med. 1959; 260: 586-591.
18. Righini M, Robert-Ebadi H. Diagnosis of acute Pulmonary Embolism. Hamostaseologie. 2018; 38: 11-21.
19. Hemnes AR, Newman AL, Rosenbaum B, et al. Bedside end-tidal CO2 tension as a screening tool to exclude pulmonary embolism. Eur Respir J. 2010; 35: 735-741.
20. Aagaard R, Lofgren B, Caap P, et al. A low end-tidal CO2/arterial CO2 ratio during cardiopulmonary resuscitation suggests pulmonary embolism. Resuscitation 2018; 133: 137-140.
21. Siragusa S, Terulla V, Pirrelli S, et al. A rapid D-dimer assay in patients presenting at the emergency room with suspected acute venous thrombosis: accuracy and relation to clinical variables. Haematologica. 2001; 86: 856-861.
22. 36th International Symposium on Intensive Care and Emergency Medicine : Brussels, Belgium. 15-18 March 2016. Crit Care 2016; 20: 94.
23. Ozdemir M, Sonmez BM, Yilmaz F, et al. Is Bedside End-Tidal CO2 Measurement a Screening Tool to Exclude Pulmonary Embolism in Emergency Department? J Clin Med Res. 2019; 11: 696-702.
24. Hedenstierna G, Sandhagen B. Assessing dead space. A meaningful variable? Minerva Anestesiol 2006; 72: 521-528.
25. Petersson J, Glenny RW. Gas exchange and ventilation-perfusion relationships in the lung. Eur Respir J 2014; 44: 1023-1041.
26. Kline JA, Meek S, Boudrow D, et al. Use of the alveolar dead space fraction (Vd/Vt) and plasma D-dimers to exclude acute pulmonary embolism in ambulatory patients. Acad Emerg Med. 1997; 4: 856-863.
27. Bonderman D, Lang IM. End-tidal CO2 for exclusion of suspected pulmonary embolism: a new partner for Wells? Eur Respir J. 2010; 35: 723-724.
28. Perrier A, Desmarais S, Goehring C, et al. D-dimer testing for suspected pulmonary embolism in outpatients. Am J Respir Crit Care Med. 1997; 156: 492-496.
29. Ginsberg JS, Wells PS, Kearon C, et al. Sensitivity and specificity of a rapid whole-blood assay for D-dimer in the diagnosis of pulmonary embolism. Ann Intern Med. 1998; 129: 1006-1011.
30. Kanis J, Hall CL, Pike J, et al. Diagnostic accuracy of the D-dimer in children. Arch Dis Child 2018; 103: 832-834.
31. Chopra N, Doddamreddy P, Grewal H, et al. An elevated D-dimer value: a burden on our patients and hospitals. Int J Gen Med. 2012; 5: 87-92.
32. Pulivarthi S, Gurram MK. Effectiveness of d-dimer as a screening test for venous thromboembolism: an update. N Am J Med Sci. 2014; 6: 491-499.
33. Rumley A, Emberson JR, Wannamethee SG, et al. Effects of older age on fibrin D-dimer, C-reactive protein, and other hemostatic and inflammatory variables in men aged 60-79 years. J Thromb Haemost. 2006; 4: 982-987.
34. Silverstein MD, Heit JA, Mohr DN, et al. Trends in the incidence of deep vein thrombosis and pulmonary embolism: a 25-year population-based study. Arch Intern Med. 1998; 158: 585-593.
35. Khoury H, Lyons R, Sanaiha Y, et al. Deep Venous Thrombosis and Pulmonary Embolism in Cardiac Surgical Patients. Ann Thorac Surg. 2020; 109: 1804-1810.
36. Konstantinides SV, Barco S, Lankeit M, et al. Management of Pulmonary Embolism: An Update. J Am Coll Cardiol. 2016; 67: 976-990.
37. Goldhaber SZ, Grodstein F, Stampfer MJ, et al. A prospective study of risk factors for pulmonary embolism in women. JAMA. 1997; 277: 642-645.
38. Kabrhel C, Varraso R, Goldhaber SZ, et al. Physical inactivity and idiopathic pulmonary embolism in women: prospective study. BMJ. 2011; 343: d3867.
39. Chauhan V, Wilkins RC. A comprehensive review of the literature on the biological effects from dental X-ray exposures. Int J Radiat Biol. 2019; 95: 107-119.
40. Parfrey PS, Griffiths SM, Barrett BJ, et al. Contrast material-induced renal failure in patients with diabetes mellitus, renal insufficiency, or both. A prospective controlled study. N Engl J Med. 1989; 320: 143-149.
41. McDonald RJ, McDonald JS, Carter RE, et al. Intravenous contrast material exposure is not an independent risk factor for dialysis or mortality. Radiology. 2014; 273: 714-725.
Received: August 10, 2021.
Accepted: September 10, 2021.
Published: September 14, 2021.
To cite this article : Najafzadeh M, Riaz I, Walker J, et al. The Use of End-Tidal CO2 as a Screening Tool in Patients with Pulmonary Embolism. European Journal of Respiratory Medicine. 2021; 3:2.
© 2021 Najafzadeh M, et al.